Better yet, use more robust frameworks like MEDDIC (Metrics, Economic Buyer, Decision Criteria, Decision Process, Identify Pain, Champion). This ensures you’re not wasting time on deals that were never going to close.
Build a Mutual Close Plan
This is your secret weapon. A mutual close plan is a shared document with your buyer that maps out every single step required to get the deal signed—their procurement process, legal review, security questionnaires, stakeholder meetings, all of it.
When you create this together, you transform from just another vendor into a trusted advisor helping them navigate their own internal bureaucracy. Plus, it makes slippage obvious immediately when steps start getting delayed.
Go Multi-Threaded From Day One
Relying on a single champion is like building your house on quicksand. If that person leaves, loses budget, or gets overruled, your deal is toast. From the very first conversation, work to identify and build relationships with multiple stakeholders—the economic buyer, end users, legal, finance, IT, and anyone else with influence.
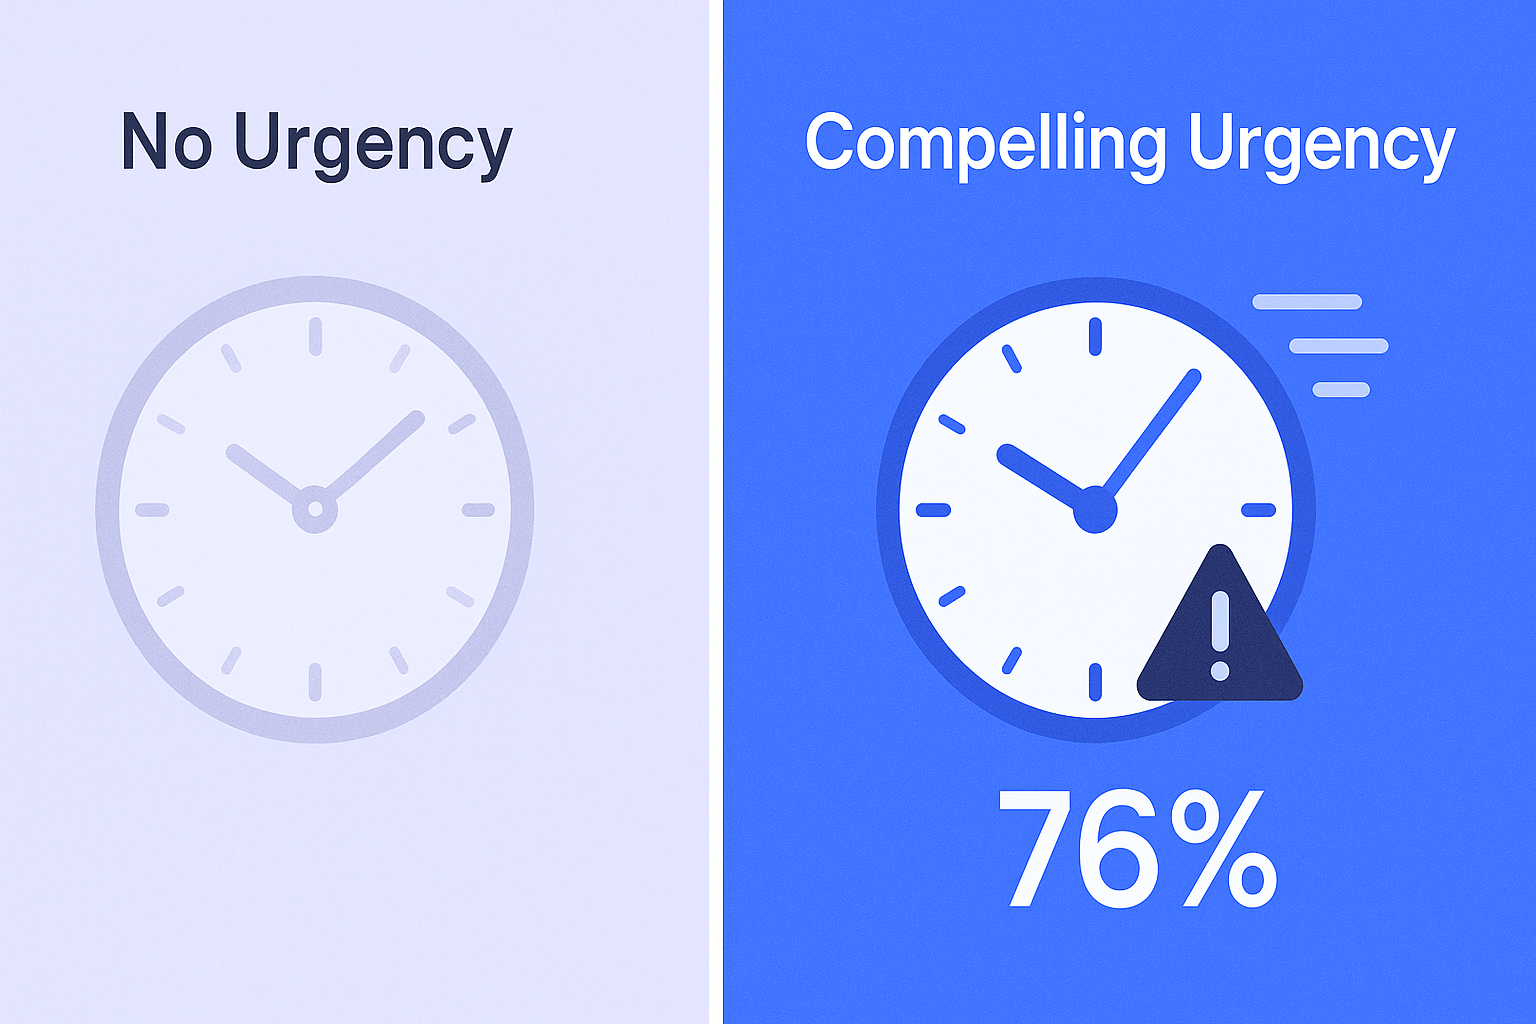
Create Real Urgency
Stop accepting “we’ll probably close it sometime next quarter” as an answer. Tie your solution to quantifiable ROI with a clear timeline. Help them calculate what every day of delay actually costs their business. Create legitimate urgency by aligning your solution to their business priorities.
Uncover Hidden Obstacles Early
Elite sellers don’t just ask about pain points. They ask about procurement processes, compliance requirements, and internal approval chains from the very first discovery call.
Here’s a perfect example: digital accessibility standards are increasingly becoming unexpected deal-killers, especially when selling to enterprise, government, or educational institutions. Smart sales professionals proactively ask, “What are your company’s requirements for ADA compliance and digital accessibility?” This question alone can prevent an 11th-hour compliance review from derailing your deal. Understanding these requirements has become essential knowledge for anyone pursuing accessibility careers in B2B sales, positioning you as a more thorough partner.
Track Buyer Actions, Not Just Your Activity
Stop relying on “good vibes” from calls. Look at concrete signals: Are they opening and forwarding your proposal? Did they invite their boss to the demo? Are they completing tasks in the mutual close plan on time? These actions predict outcomes far better than verbal commitments.
Final Thought
Here’s the reality: deal slippage will never go to zero. Some deals will always push for legitimate reasons completely outside your control. But the difference between average performers and quota crushers isn’t eliminating slippage entirely—it’s reducing it from 40% to 20%, or from 25% to 15%.
Every percentage point you reduce your slip rate directly translates to more closed revenue.
The good news? Unlike getting more leads or changing your territory, reducing slippage is 100% within your control. Better qualification, tighter process discipline, stronger stakeholder engagement—these are skills you can develop starting today.
Stop letting your pipeline happen to you. Start making it work for you. Track your metrics, implement the strategies above, and watch your forecast accuracy—and your closed-won revenue—transform.
Ready to take control of your outreach and stop deals from slipping in the first place? Verify your contact data to ensure you’re reaching the right decision-makers from the start, and check out our guide on B2B email marketing statistics to craft messages that actually move deals forward.
Other Useful Resources
To understand how to systematically achieve LinkedIn’s 40-50% connection rates and 10-25% reply rates eliminating email’s 5.8% and cold calling’s 2.3% challenges, explore these resources:
Data Quality & Pipeline Tools:
Prospecting Strategy:
LinkedIn Content:
Platform Intelligence:
BDR outreach statistics document the systematic multi-channel complexity crisis—90% of teams multi-thread engaging 9 contacts per account with 21 touches each totaling 189 touches per account to qualify opportunities, yet maintaining this orchestration across email (5.8% reply down from 6.8%, brutal 0.2153% conversion requiring 464 emails per deal, 17% personalized vs 7% generic demonstrating 142% personalization boost only 5% execute), phone (70% pipeline source despite 2.3% cold call success requiring 18+ dials to connect and 8 calls per meeting), and LinkedIn (40-50% connection acceptance, 45% personalized vs 15% generic, 10-25% InMail reply, 19.98% post-connection response) demands infrastructure most teams lacking systematic coordination cannot implement consistently. The optimization opportunities documented prove difficult to execute simultaneously: email requires 6-8 sentences/101-200 words achieving 6.9% reply with Thursday 6.87% best day and evening 8-11PM/morning 7-11AM timing optimization plus 49% boost from single follow-up (but 20% decrease from third creating diminishing returns management), phone demands converting intent signals not pure cold discovery since 2.3% raw success fails as standalone channel, and LinkedIn needs profile optimization, personalized connection requests, sub-400 character messages, and Tuesday 6.90% timing coordination—all while AI adoption creates Pipeline Paradox where 87% report positive impact and 65% enhanced productivity yet 71.5% receive minimal training resulting in 35% qualified pipeline increase but only 10-20% revenue growth revealing efficiency-not-effectiveness application preventing 200-300% ROI, 15-25% productivity gains, 30-40% cost savings, and 15% win rate improvements from materializing without strategic AI implementation beyond tactical automation. The funnel leakage compounds execution challenges: 1000 emails → 58 replies (5.8%) → 3 meetings (5% conversion) → 2.25 attended (75% show) → 1 opportunity (46% conversion) demonstrates compound attrition where even perfect channel optimization battles leaky meeting funnel (67-80% show rates, 46% opportunity conversion), lead-to-meeting conversion varying wildly (5-10% low-intent vs 75-80% high-intent vs 2-5% outbound general), and meetings-booked vanity metrics hiding that quality focus (10 meetings × 90% show × 60% opportunity = 5.4 pipeline) beats volume (15 meetings × 67% show × 46% opportunity = 4.6 pipeline). The environmental factors compound individual performance: 88% average quota attainment masks massive divide where supported teams hit 95% but unsupported hit only 80%, yet only 58% feel supported (down from 76% in 2022) creating widening performance gap, while 39% raised quotas in 2024 and 35% in 2025 creating rising expectations without proportional support infrastructure preventing systematic 189-touch-per-account multi-threading across all channels most teams coordinating 21 touches per contact across 9 stakeholders cannot execute while maintaining email personalization, phone intent conversion, LinkedIn optimization, AI strategic application, and quality-over-volume focus preventing vanity meeting metrics from converting into actual qualified pipeline opportunities. The article’s repeated banner positioning addresses the fundamental solution: “Crushing Quota with LinkedIn Outbound” delivering 40-50% connection + 10-25% reply systematically, “Master Multi-Threading on LinkedIn” engaging 9+ stakeholders per account with personalized scalable sequences, “LinkedIn Beats Email 3X” achieving 10-25% reply versus 5.8% email with complete strategy, “Scale Your LinkedIn Pipeline” delivering 40-50% connections and 3x email performance consistently, and “LinkedIn + AI = Pipeline Growth” generating 35% more qualified pipeline through complete targeting and scaling combining platform advantages with AI strategic application. Our complete LinkedIn outbound system eliminates the multi-channel orchestration crisis systematically—delivering 15-25% response rates through done-for-you targeting, campaign design, and scaling that achieves LinkedIn’s documented 40-50% connection rates and 10-25% reply rates (3x email’s 5.8%, 10x cold calling’s 2.3% success) without requiring 189-touch-per-account coordination, email’s 6-8 sentence/101-200 word optimization plus Thursday 6.87%/evening timing management plus 49% follow-up discipline, phone’s 18+ dial burden converting intent signals, AI’s 71.5% minimal training preventing strategic effectiveness application, or the environment/support dependency (58% vs 76% supported) creating 95% vs 80% quota attainment divide, executing multi-threading across 9+ stakeholders per account automatically, combining LinkedIn verified data with AI personalization eliminating Pipeline Paradox (35% pipeline but 10-20% revenue), and converting outreach statistics into actual qualified pipeline generation through systematic execution that achieves supported-team 95% quota benchmarks without the multi-channel coordination complexity, leaky funnel waste (67-80% shows, 46% opportunities), meetings-booked vanity metrics, or rising quotas without proportional support preventing most teams from converting outreach knowledge into consistent quota-crushing performance across every channel and funnel stage documented throughout comprehensive outreach statistics revealing what separates 95% supported performers from 80% unsupported strugglers through systematic LinkedIn-first execution eliminating the entire email/phone/multi-channel orchestration burden.