🎉Find Prospects and Send Cold Emails & LinkedIn Outbound | All in One Place

17 Ecommerce Marketing Statistics to Know in 2025 (And What They Mean for Your Business)

Table of Contents

17 Ecommerce Marketing Statistics

  • Global ecommerce sales will reach $7.4 trillion in 2025 – with $1.47 trillion in the U.S. alone, representing the largest retail transformation in history
  • Ecommerce will account for nearly 24% of total global retail sales by 2025 – up from 18% just five years ago
  • Mobile commerce will account for 44.2% of all ecommerce sales by 2025 – projected to reach $710 billion in the U.S.
  • Mobile generates 78% of retail site traffic but has significantly lower conversion rates – with cart abandonment rates of 80-85% compared to 70% on desktop
  • 58% of shoppers say fast and reliable shipping is the most important factor – beating competitive pricing (46.8%)
  • Free shipping encourages 9 out of 10 people to complete a purchase – while unexpected shipping costs are the #1 reason for cart abandonment
  • 81% of retail shoppers conduct online research before making a purchase – with 93% starting with a search engine
  • 59% of online shoppers use Google to find reviews – with customer reviews increasing conversion rates by up to 190%
  • Organic search drives 43% of ecommerce traffic – with SEO leads having a 14.6% close rate compared to 1.7% for outbound leads
  • Email marketing delivers an average return of $45 for every $1 spent – an ROI of 4500%, making it one of the most profitable channels
  • Personalizing emails can increase revenue by up to 760% – with segmented campaigns seeing 27.6% higher open rates
  • Social commerce market will reach $2.9 trillion by 2026 – expected to account for 17% of all online sales in 2025
  • Videos on social media get shared 12 times more than photos and text combined – with 82% of consumers convinced to purchase after watching a brand’s video
  • 48% of users abandon their cart because extra costs are too high – representing $260 billion in recoverable lost orders through better checkout design
  • One-second delays in site load time can reduce conversions by 7-17% – with 53% of mobile visitors leaving if a site takes longer than 3 seconds to load

The ecommerce world moves fast. What worked last year might already be outdated, and staying ahead means knowing the numbers that actually matter.

Whether you’re a startup founder, marketing manager, or business owner, these 17 ecommerce marketing statistics will give you the insights you need to make smarter decisions, optimize your strategy, and drive more sales in 2025.

Table of Contents

  • How We Collect These Statistics
  • 17 Ecommerce Marketing Statistics
  • Conclusion

How We Collect These Statistics

The statistics in this article come from a careful analysis of data from industry leaders like Statista, eMarketer, Baymard Institute, and official sources including the U.S. Census Bureau. This approach ensures you get accurate, actionable insights from the most reliable sources in the industry.

17 Ecommerce Marketing Statistics

The Big Picture: Market Growth and Opportunity

Global ecommerce sales will reach $7.4 trillion in 2025

The ecommerce industry isn’t just growing—it’s exploding. With projections hitting $7.4 trillion globally and $1.47 trillion in the U.S. alone, we’re looking at the largest retail transformation in history.


But here’s what the headlines don’t tell you: the explosive pandemic growth has stabilized to a more sustainable 8-9% annual growth rate. This means businesses can’t just ride the wave anymore—they need to compete smarter.

Ecommerce will account for nearly 24% of total global retail sales by 2025

Just five years ago, ecommerce represented 18% of retail sales. The jump to 24% represents a fundamental shift in how people shop. In the U.S., ecommerce consistently accounts for over 16% of all retail sales.

What’s fascinating is that 73% of shoppers now use multiple channels during their purchasing journey, and 80% use their mobile phones to research while inside physical stores. The customer journey isn’t linear anymore—it’s everywhere.

Mobile commerce will account for 44.2% of all ecommerce sales by 2025

Mobile sales in the U.S. hit $431 billion in 2022 and are projected to reach $710 billion by 2025. But here’s the challenge: while smartphones generate 78% of retail site traffic, they have significantly lower conversion rates than desktops.

This creates what we call the “Mobile Paradox”—mobile drives the most traffic but converts the worst, with cart abandonment rates of 80-85% compared to 70% on desktop.

📱 Skip The Mobile Conversion Battle

Target enterprise buyers on LinkedIn where 84% of B2B decision-makers actively engage—no cart abandonment, just direct conversations

Understanding Your Customers

58% of shoppers say fast and reliable shipping is the most important factor when shopping online

This beats competitive pricing (46.8%). Free shipping encourages 9 out of 10 people to complete a purchase, while unexpected shipping costs are the number one reason for cart abandonment.

The “Amazon Effect” has set the bar high—two-day shipping isn’t a luxury anymore, it’s the expected standard.

81% of retail shoppers conduct online research before making a purchase

The customer journey almost always begins online. 93% of internet users start with a search engine, and 51% use Google specifically to research purchases they plan to make.


📱 Skip The Mobile Conversion Battle

Target enterprise buyers on LinkedIn where 84% of B2B decision-makers actively engage—no cart abandonment, just direct conversations

Understanding Your Customers

58% of shoppers say fast and reliable shipping is the most important factor when shopping online

This beats competitive pricing (46.8%). Free shipping encourages 9 out of 10 people to complete a purchase, while unexpected shipping costs are the number one reason for cart abandonment.

The “Amazon Effect” has set the bar high—two-day shipping isn’t a luxury anymore, it’s the expected standard.

81% of retail shoppers conduct online research before making a purchase

The customer journey almost always begins online. 93% of internet users start with a search engine, and 51% use Google specifically to rese


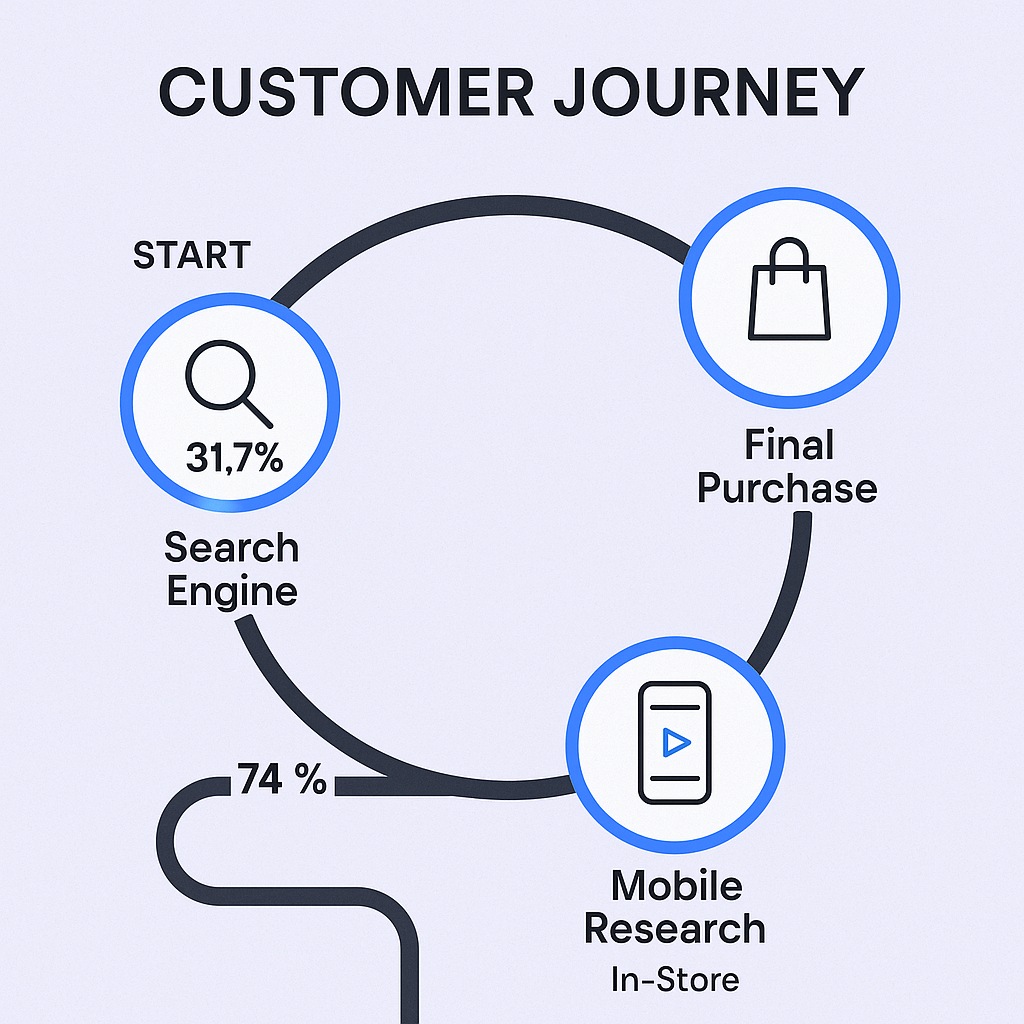
This research phase happens across multiple platforms. While search engines are the top starting point (31.7% of users), 74% are also influenced by social networks, and Gen Z discovers products overwhelmingly through social media.

59% of online shoppers use Google to find reviews

Customer reviews increase conversion rates by up to 190%, especially for higher-priced items. Yet 88% of users are less likely to return to a site after one bad experience, and 75% of businesses don’t respond to negative reviews.

Public responses to negative reviews can actually build more trust than perfect five-star ratings, which often appear artificial.

Gen Z is 16.4% more likely to shop online than the average consumer

85% of Gen Z discovers products on social media, but different generations shop differently:

  • Gen X: Most active shoppers (19 transactions per year)
  • Baby Boomers: Highest spending per transaction
  • Millennials: Strategic about sales events
  • Gen Z: Social-first discovery and mobile-native

Where to Focus: Marketing Channels That Work

Organic search drives 43% of ecommerce traffic

Combined with paid search, all search traffic generates 65% of total ecommerce sessions. SEO leads have a 14.6% close rate compared to 1.7% for outbound leads.

The top three Google results get 54% of all clicks, but achieving these positions takes time—the average top-ranking page is three years old. This positions SEO as a long-term competitive advantage.

Email marketing delivers an average return of $45 for every $1 spent

This ROI of 4500% makes email one of the most profitable marketing channels. Automated emails drive 320% more revenue than standard broadcast emails.

With third-party cookies disappearing, email lists become even more valuable as first-party data assets that brands own and control.

 💼 Beat The $45 Email ROI

LinkedIn outbound delivers enterprise clients worth 10x more—precision targeting, campaign design, and proven scaling methods that close deals

Personalizing emails can increase revenue by up to 760%

Segmented campaigns see 27.6% higher open rates, and personalized calls-to-action convert 202% better than generic versions. 49% of customers have made unintended purchases after receiving personalized product recommendations.

The key is using first-party data (past purchases, browsing history) rather than invasive tracking to deliver relevant experiences.

The social commerce market will reach $2.9 trillion by 2026

This represents a massive jump from $992 billion in 2022. About half of U.S. adults have made purchases via social media, expected to account for 17% of all online sales in 2025.

The challenge? Brands don’t fully “own” the customer relationship when selling through social platforms, creating dependency risks.

🎯 Own Your B2B Pipeline Completely

LinkedIn outbound puts you in control—direct access to 10M C-level executives with targeted campaigns you own, not algorithm-dependent posts d LinkedIn Targeting

7-day Free Trial |No Credit Card Needed.

Videos on social media get shared 12 times more than photos and text combined

82% of consumers report being convinced to purchase after watching a brand’s video, and 54% want to see more video content from supported brands. Short-form video currently reigns as the top-performing content format.

New technologies like TikTok Shop and YouTube Shopping are merging video content directly with purchase points, collapsing the traditional marketing funnel.

Converting Traffic Into Sales

The average ecommerce conversion rate is between 2% and 4%

This means 96-98 out of every 100 visitors leave without buying. Conversion rates vary significantly by industry:

  • Personal Care/Health & Beauty: 6.8%
  • Food & Beverage: 3.6-4.95%
  • Electronics: 3.6%
  • Fashion/Apparel: 1.9-2.20%
  • Home Decor: 1.4-1.9%
  • Luxury/Jewelry: <1%

48% of users abandon their cart because extra costs are too high

This is the undisputed number one reason for cart abandonment, followed by required account creation (24-26%) and lengthy checkout processes (18-22%).

These friction points represent $260 billion in recoverable lost orders through better checkout design alone.

Abandoned cart email campaigns have an 18.54% average conversion rate

These automated emails have 40-45% open rates and are one of the most proven methods for recovering lost revenue. Yet only 50% of the top 100 ecommerce businesses send them.

This represents massive untapped opportunity even among sophisticated players.

One-second delays in site load time can reduce conversions by 7-17%

The highest conversion rates occur when pages load in under two seconds. On mobile, 53% of visitors leave if a site takes longer than three seconds to load.

Site performance isn’t an IT issue—it’s a sales and marketing issue with direct financial impact.

49% of customers bought products they didn’t intend to buy because of personalized recommendations

This highlights the power of artificial intelligence (AI) to increase Average Order Value (AOV). Consumer acceptance is growing, with 50% willing to purchase from website chatbots and 52% comfortable with AI shopping assistants.

AI is shifting from novelty to necessity, now used for personalization, dynamic pricing, supply chain visibility (46% of retailers), and content creation.

Conclusion

The ecommerce landscape in 2025 is massive and growing, but also more competitive than ever. Success requires understanding these key trends:

The Mobile-First Reality: With 44% of sales happening on mobile devices, optimizing for mobile isn’t optional—it’s survival.

The Power of Email: At $45 return for every $1 spent, email remains the highest ROI marketing channel, especially as third-party cookies disappear.

Personalization Wins: From 760% revenue increases in email to 49% of unplanned purchases from recommendations, personalization directly drives sales.

Speed Matters: Whether it’s shipping expectations or site load times, friction kills conversions.

Social Commerce Explosion: The $2.9 trillion social commerce market represents a fundamental shift in how people discover and buy products.

The businesses that thrive in 2025 won’t just have an online presence—they’ll have optimized, data-driven strategies that turn these statistics into competitive advantages. The question isn’t whether ecommerce will continue growing, but whether your business will grow with it.

Ready to turn these insights into action? The data shows the opportunities—now it’s time to capture them.

Scale Your LinkedIn Outbound Like the Top 1%

Share your current approach. We’ll show you exactly how to 10X your qualified conversion

Segmentation That Actually Converts

LinkedIn outbound targets precise demographics with strategic campaign design and scaling methods

How to Build a High-Converting B2B Sales Funnel from Scratch on LinkedIn ​