🎉Find Prospects and Send Cold Emails & LinkedIn Outbound | All in One Place

Ecommerce Shopping Statistics 2025: 26 Data Points That Drive Revenue

Table of Contents

Ecommerce Shopping Statistics

  • U.S. ecommerce sales reached $304.2 billion in Q2 2025 – representing a 5.3% increase from the previous year
  • Ecommerce accounts for 16.3% of total retail sales – for every six dollars spent in U.S. retail, one happens online
  • Global ecommerce will hit $6.42 trillion in 2025 – with the U.S. controlling 39.1% and China 37.8% of this market
  • B2B ecommerce dwarfs B2C at $32.11 trillion globally – representing the true powerhouse of digital commerce, growing at 14.5% CAGR
  • Mobile devices drive 66.88% of all web traffic – smartphones have become the primary gateway to ecommerce
  • Mobile conversion rates lag at just 1.8% – compared to desktop’s 3.9%, representing the largest untapped revenue opportunity
  • U.S. mobile commerce will reach $710 billion in 2025 – globally, m-commerce expected to hit $2.52 trillion (60% of all ecommerce sales)
  • 85% of users expect mobile experiences to match or exceed desktop – making it a baseline requirement, not a nice-to-have
  • Social commerce will generate nearly $80 billion in U.S. sales – representing over 17% of all online purchases in 2025
  • Instagram dominates product discovery with 61% usage – while Facebook captures 39% of direct purchases
  • 74% of shoppers buy based on influencer suggestions – with 35% purchasing directly from live-stream shopping events
  • 83% of consumers consider free shipping critical – with over 90% abandoning purchases when faced with unexpected shipping costs
  • 99% of shoppers read reviews before purchasing – with 96% specifically seeking negative reviews to understand potential downsides
  • 70% of shopping carts get abandoned – representing an $18 billion annual loss across ecommerce, spiking to 85.65% on mobile
  • Abandoned cart emails achieve 41.18% open rates – with 10.7% recovering the sale and generating $5.81 revenue per recipient

The ecommerce landscape has evolved dramatically. Gone are the days when simply having an online store guaranteed growth. Today’s market demands precision, optimization, and deep understanding of consumer behavior.

These ecommerce shopping statistics reveal exactly what drives purchasing decisions, where the biggest opportunities lie, and how smart businesses are capitalizing on emerging trends. Whether you’re looking to reduce cart abandonment, improve mobile conversions, or understand social commerce dynamics, this data will guide your strategy.

How We Collect These Statistics

Our ecommerce shopping statistics come from authoritative sources including government data (U.S. Census Bureau), industry research firms (Statista, eMarketer), platform reports (Shopify, Google), and academic studies. We prioritize recent data from 2024-2025 to ensure relevance.

Each statistic undergoes verification through cross-referencing multiple sources. When studies show conflicting numbers, we note the variance and explain the methodology behind each figure. This rigorous approach ensures you’re making decisions based on reliable, actionable data rather than outdated assumptions.

26 Online Shopping Statistics That Matter

Market Size and Growth

  1. U.S. ecommerce sales reached $304.2 billion in Q2 2025 The digital economy continues its steady expansion with a 5.3% increase from the previous year. This represents a normalization from the explosive pandemic-era growth, settling into sustainable patterns that reward optimization over mere presence.
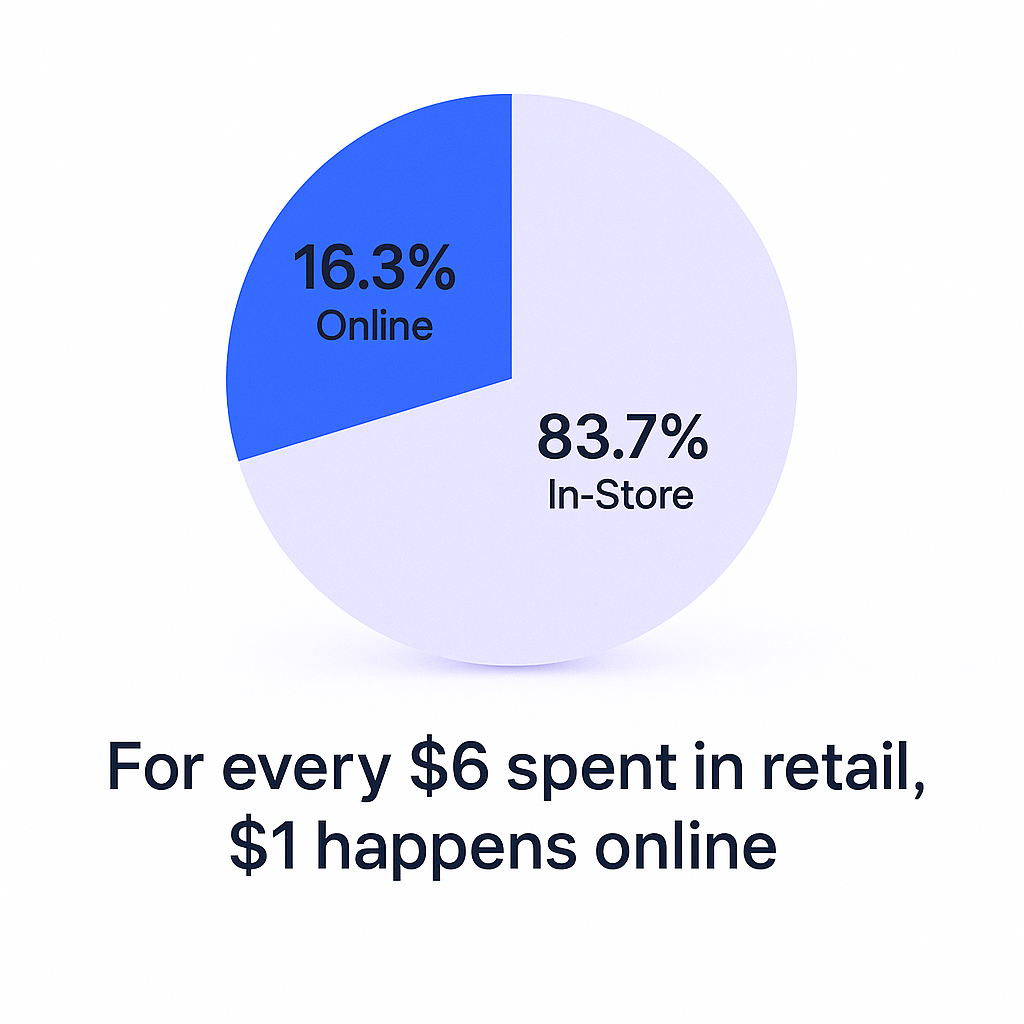
  2. Ecommerce accounts for 16.3% of total retail sales For every six dollars spent in U.S. retail, one happens online. This percentage demonstrates ecommerce’s maturity as a channel while highlighting the continued importance of omnichannel strategies.


  1. Global ecommerce will hit $6.42 trillion in 2025 The worldwide digital marketplace showcases the immense scale of online shopping, with the U.S. controlling 39.1% of this market in direct competition with China’s 37.8% share.
  2. B2B ecommerce dwarfs B2C at $32.11 trillion globally While consumer brands capture headlines, business-to-business transactions represent the true powerhouse of digital commerce, growing at a 14.5% CAGR and requiring sophisticated solutions for complex procurement needs.

🎯 Target $32 Trillion B2B Buyers

LinkedIn outbound reaches decision-makers in this massive market with surgical precision daily.

Mobile Commerce Revolution

  1. Mobile devices drive 66.88% of all web traffic Smartphones have become the primary gateway to ecommerce, yet many businesses still treat mobile as a secondary consideration rather than their primary customer touchpoint.
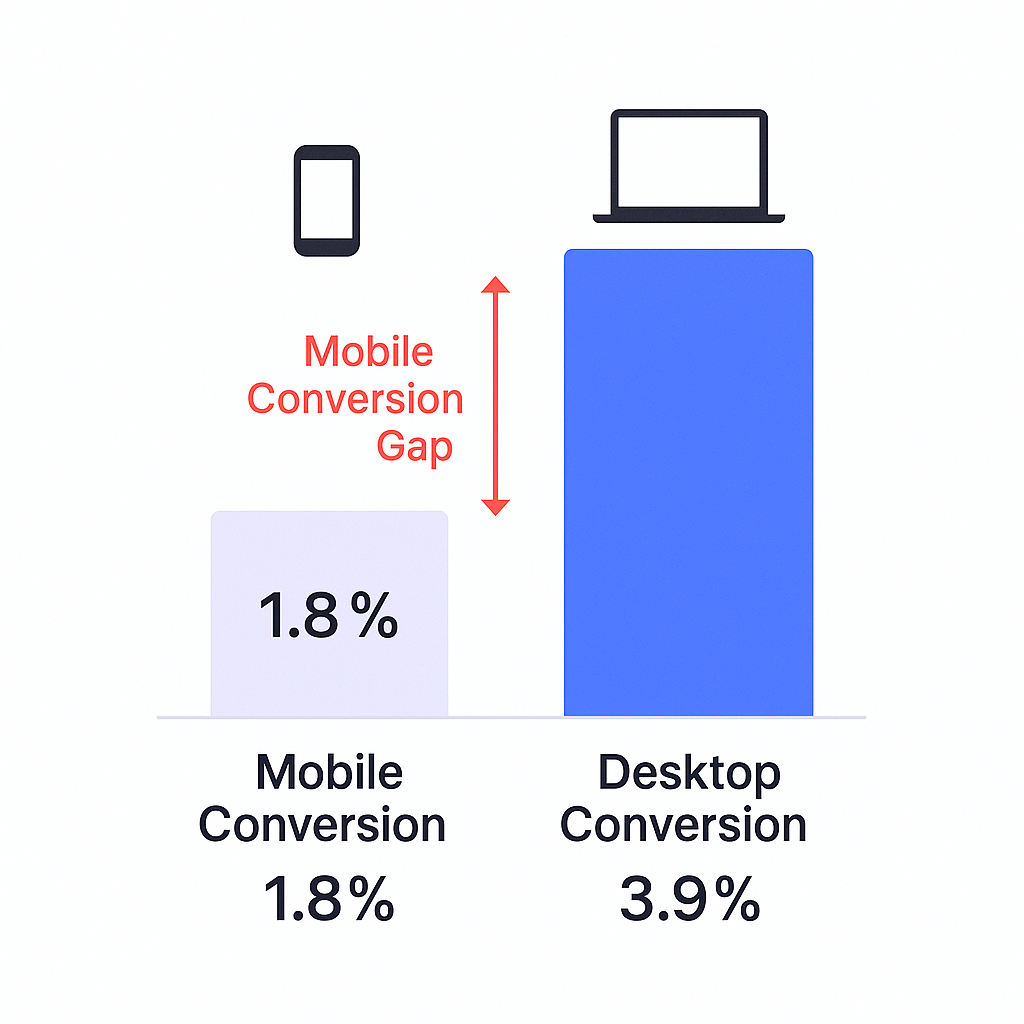
  2. Mobile conversion rates lag at just 1.8% Despite dominating traffic, mobile conversions remain significantly lower than desktop’s 3.9%. This “mobile conversion gap” represents one of the largest untapped revenue opportunities in ecommerce today.


💼 Skip The Conversion Gap

LinkedIn outbound delivers 3-5% qualified meeting rates. No mobile optimization headaches required.

  1. U.S. mobile commerce will reach $710 billion in 2025 Even with lower conversion rates, the sheer volume of mobile traffic translates into massive revenue. Globally, m-commerce is expected to hit $2.52 trillion, accounting for 60% of all ecommerce sales.
  2. 76% of U.S. adults shop using smartphones Consumer intent to purchase via mobile is clear, but execution often fails. The gap between desire and completion points to fundamental user experience problems rather than lack of demand.
  3. 85% of users expect mobile experiences to match or exceed desktop When mobile sites fail to meet these expectations, nearly half of users express frustration. This isn’t a “nice-to-have” – it’s a baseline requirement for competitive participation.
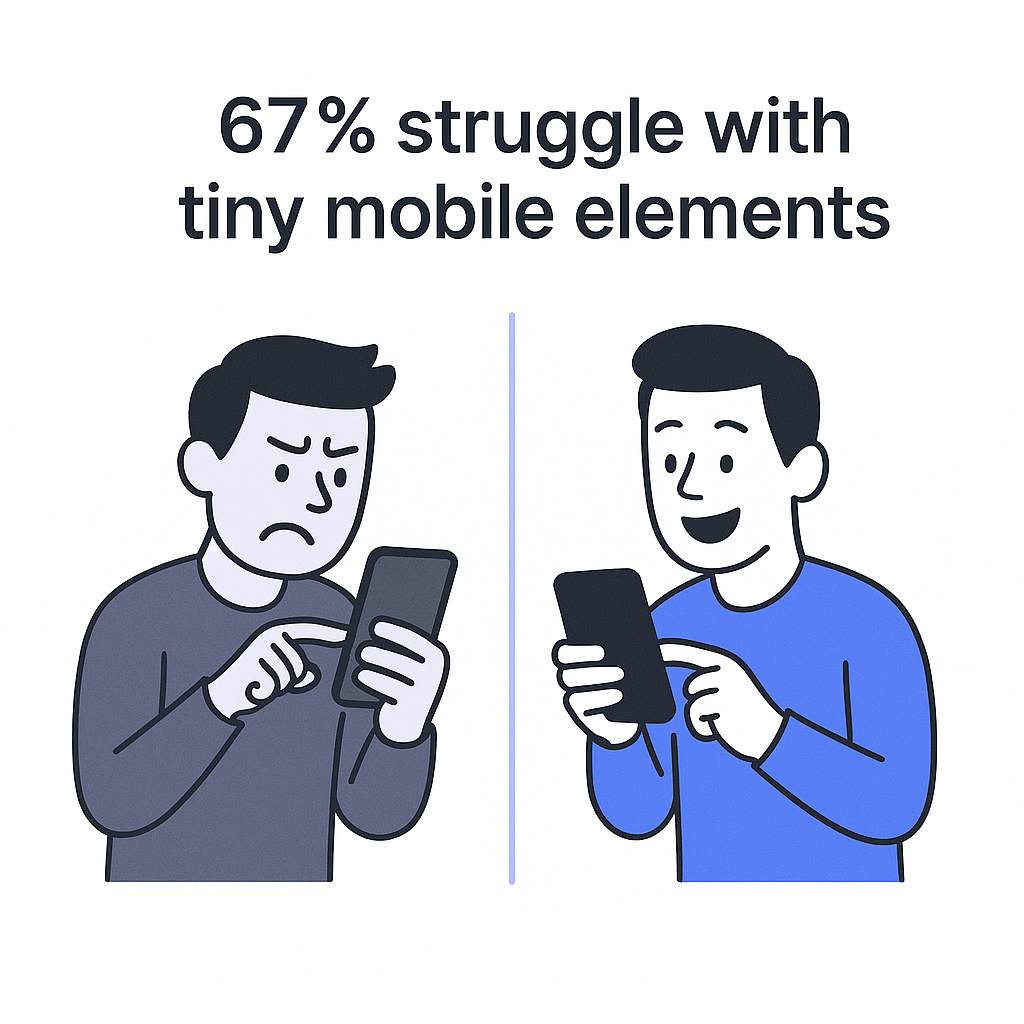
  4. 67% cite “pages and links too small to click” as the top mobile barrier This statistic reveals that the mobile conversion gap often stems from basic usability failures rather than complex technological challenges. Simple fixes can yield dramatic improvements.


Social Commerce Explosion

  1. Social commerce will generate nearly $80 billion in U.S. sales Social platforms have evolved from marketing channels to transactional environments, with social sales representing over 17% of all online purchases in 2025.
  2. 5.42 billion people use social media worldwide The average person actively uses 6.8 different social platforms monthly, creating a complex, multi-touchpoint customer journey that requires coordinated strategies across channels.
  3. Instagram dominates product discovery with 61% usage While Instagram leads in helping consumers find products, Facebook captures 39% of direct purchases, showing how different platforms serve different stages of the buying journey.
  4. TikTok reaches 1.59 billion potential advertising targets This massive reach makes TikTok essential for trend discovery and younger demographic engagement, particularly Gen Z consumers who drive significant purchasing power.
  5. Brands with active social presence see 32% more sales Social media isn’t just about awareness anymore. Active engagement directly correlates with revenue increases, driven by social proof and trusted recommendations.
  6. 74% of shoppers buy based on influencer suggestions The power of trusted voices in purchasing decisions has made influencer partnerships a cornerstone of modern ecommerce strategy, with 35% of consumers purchasing directly from live-stream shopping events.

Consumer Behavior Insights

  1. 83% of consumers consider free shipping critical Free shipping has evolved from a competitive advantage to an entry requirement. Over 90% will abandon purchases when faced with unexpected shipping costs, making transparent pricing essential.
  2. 99% of shoppers read reviews before purchasing Review consumption is nearly universal, with 96% specifically seeking negative reviews to understand potential downsides. This behavior emphasizes the importance of authentic, well-managed reputation systems.
  3. 81% of shoppers research online before buying Even for in-store purchases, the customer journey typically begins with online research. This makes digital presence crucial regardless of final purchase location.
  4. 44% of shopping journeys start with search engines Search optimization remains fundamental to ecommerce success, as nearly half of all purchase processes begin with platforms like Google rather than direct brand visits.

The Cart Abandonment Challenge

  1. 70% of shopping carts get abandoned Seven out of ten customers who show clear purchase intent by adding items to their cart ultimately leave without buying. This represents an $18 billion annual loss across ecommerce.
  2. Mobile abandonment rates spike to 85.65% The abandonment problem becomes even more severe on mobile devices, highlighting the urgent need for mobile-optimized checkout experiences.
  3. 47% abandon due to extra costs (shipping, taxes) Unexpected fees remain the primary abandonment trigger, followed by required account creation (25%), slow delivery times (24%), and complicated checkout processes (18%).

🚀 No Cart Abandonment Issues

LinkedIn outbound connects you directly with buyers. Start conversations before checkout frustrations.

  1. Abandoned cart emails achieve 41.18% open rates Recovery emails significantly outperform standard marketing emails, demonstrating high customer engagement when targeting qualified prospects who were moments from purchasing.
  2. 10.7% of abandoned cart emails recover the sale Among those who receive recovery emails, the conversion rate is substantial. Of customers who click the email link, 50% complete their purchase, often with 58% higher order values.
  3. Cart recovery generates $5.81 revenue per recipient This remarkable ROI makes abandoned cart recovery one of the highest-return activities in ecommerce, transforming lost sales into increased revenue with minimal additional investment.

Industry-Specific Conversion Benchmarks

Understanding how your performance compares to industry standards helps identify optimization opportunities:

  • Personal Care & Beauty: 6.8% conversion rate
  • Consumer Electronics: 3.6% conversion rate
  • Fashion & Apparel: 1.6-1.9% conversion rate
  • Home Decor: 1.9% conversion rate

These benchmarks reflect factors like purchase frequency, price points, and consideration time. Beauty products benefit from high repeat purchases and brand loyalty, while apparel faces longer consideration periods and higher return rates.

The Revenue Impact of Optimization

Converting these statistics into action requires understanding their financial implications. Consider a typical ecommerce business with $500,000 monthly revenue:

  • Mobile optimization could recover 30% of the conversion gap, potentially adding $150,000+ monthly
  • Cart abandonment recovery targeting just 10% recovery could generate $116,000+ monthly
  • Social commerce integration might capture an additional 5% of social traffic, worth $25,000+ monthly

The compounding effect of addressing multiple optimization areas simultaneously often exceeds the sum of individual improvements.

📈 Multiply Your Revenue Channels

Add LinkedIn outbound to your strategy. Complete targeting, campaign design, and scaling included.

7-day Free Trial |No Credit Card Needed.

Taking Action on These Insights

These ecommerce statistics paint a clear picture: success requires systematic optimization across mobile experience, social commerce integration, and conversion funnel management. The businesses thriving in 2025 aren’t just participating in digital commerce – they’re excelling at every touchpoint.

The mobile conversion gap alone represents billions in recoverable revenue. Cart abandonment recovery offers immediate, high-ROI improvements. Social commerce provides new channels for customer acquisition and engagement.

Start with the areas showing the largest gaps in your business. Mobile experience issues are often the quickest wins, followed by cart abandonment sequences, then social commerce integration. Each improvement builds on the others, creating momentum toward sustainable growth in an increasingly competitive marketplace.

Conclusion

The ecommerce landscape of 2025 rewards businesses that understand and act on data-driven insights. These 26 statistics reveal clear patterns: mobile optimization is critical, social commerce is essential, and cart abandonment represents the largest immediate opportunity for revenue recovery.

The era of easy ecommerce growth has ended. Success now requires precision execution across multiple channels and touchpoints. The businesses that thrive will be those that transform these statistics from interesting data points into systematic optimization strategies.

Your next steps are clear. Audit your mobile experience, implement cart recovery systems, and develop your social commerce strategy. The data shows exactly where the opportunities lie – now it’s time to capture them.

Sources:

  • U.S. Census Bureau Quarterly Retail E-Commerce Sales
  • Statista Global E-commerce Statistics 2025
  • Google Consumer Insights Report
  • Shopify Commerce Trends Report
  • Various industry research and platform studies


FAQs

Is LinkedIn Premium guaranteed to get me a job?

No, LinkedIn Premium is not a guarantee. It's a powerful tool that can significantly enhance your job search by providing advanced features and insights, but success still depends on factors like your profile strength, experience, industry, and how effectively you utilize the premium tools.

What are the main benefits of LinkedIn Premium for job seekers?

The main benefits LinkedIn Premium offers include direct messaging via InMail, seeing all profile visitors, access to advanced search filters LinkedIn, "Featured Applicant" status, applicant and salary insights, and unlimited access to LinkedIn Learning courses.

How does LinkedIn Premium help me stand out to recruiters?

LinkedIn Premium Career helps you stand out by allowing "Featured Applicant" applications and marking jobs as "Top Choice," making you 43% more likely to receive recruiter responses. InMails to hiring managers help bypass traditional application channels.

Can I try LinkedIn Premium for free?

Yes, eligible LinkedIn members can typically try LinkedIn Premium with a 30-day trial. This allows feature exploration before committing to a LinkedIn Premium subscription.

Is the "Who's Viewed Your Profile" feature truly useful?

Yes, seeing who has viewed your profile acts as a warm lead indicator. Proactively reaching out to these individuals can significantly increase engagement chances, as prospects are 86% more likely to accept an InMail if you view their profile first.

What is the "agreement privacy policy" related to LinkedIn Premium?

The agreement privacy policy refers to LinkedIn's privacy policy governing data collection, use, and sharing. Premium features like anonymous browsing interact with privacy settings, though LinkedIn still tracks anonymous visits. Users should review LinkedIn's official privacy policy for comprehensive details.

Scale Ecommerce With LinkedIn Outbound

Convert B2B buyers while competitors chase consumer clicks. Strategic targeting drives revenue.

Segmentation That Actually Converts

LinkedIn outbound targets precise demographics with strategic campaign design and scaling methods

How to Build a High-Converting B2B Sales Funnel from Scratch on LinkedIn ​