🎉Find Prospects and Send Cold Emails & LinkedIn Outbound | All in One Place

Ecommerce Usage Statistics 2025: The Complete Data-Driven Guide for Business Growth

Table of Contents

Ecommerce Usage Statistics 

  • Global ecommerce market projected to reach $6,478 billion by 2029 – growing at 7.83% from 2025-2029
  • 2.77 billion online shoppers globally as of 2025 – meaning 33% of the world’s population is shopping online
  • 21% of retail purchases take place online in 2025 – the highest percentage to date
  • U.S. ecommerce retail marketplaces made $428.3 billion in 2024 – up 11.4% year-over-year, expected to reach $477.7 billion in 2025
  • Mobile commerce accounts for 59% of total retail ecommerce sales – representing $4.01 trillion in 2025
  • 65.3% of ecommerce site traffic comes from mobile phones – with 76% of U.S. adults purchasing using smartphones
  • Mobile conversion rate only 2.0% – 16.7% lower than desktop, representing massive optimization opportunity
  • Social commerce will become a trillion-dollar market by 2025 – with global sales expected to hit $1.2 trillion
  • 70% of shopping carts are being abandoned – costing ecommerce stores $18 billion in revenue annually
  • Value of abandoned goods in U.S. shopping carts is around $705 billion – with $260 billion recoverable through better checkout design
  • 92% of businesses are using generative AI – to enhance the ecommerce experience through personalization
  • Amazon accounts for 40.9% of total retail ecommerce sales in the U.S. – representing $540.29 billion in gross sales in 2025
  • Asia-Pacific ecommerce market valued at $4.2 trillion in 2024 – expected to reach $6.76 trillion by 2029
  • Subscription ecommerce sector anticipated to surpass $450 billion by 2025 – a 30x growth from its $15 billion valuation in 2019
  • B2B ecommerce market valued at $32.11 trillion as of 2025 – growing at 14.5% CAGR, significantly outpacing B2C ecommerce

The ecommerce landscape is exploding with unprecedented growth, and the numbers tell a story that every business owner needs to hear. With global ecommerce sales projected to reach $6,478 billion by 2029 and 2.77 billion online shoppers globally as of 2025, we’re witnessing the most significant shift in retail history.

Whether you’re a startup founder, marketing manager, or business executive, these statistics will arm you with the insights needed to make smarter decisions in today’s digital marketplace. From mobile commerce dominating with 59% of total ecommerce sales to social platforms driving $1.2 trillion in global sales by 2025, the data reveals where opportunity lies.

Let’s dive into the numbers that are reshaping commerce as we know it.

How Do We Collect These Statistics?

Understanding the source of ecommerce data is crucial for making informed business decisions. The statistics in this guide come from a combination of authoritative industry sources, ensuring accuracy and reliability.

Primary Data Sources:

  • Government agencies like the U.S. Census Bureau provide official retail trade data and quarterly ecommerce reports
  • Research institutions such as Statista, eMarketer, and Baymard Institute conduct comprehensive market analysis
  • Technology platforms including Shopify, Amazon, and major ecommerce platforms share aggregated user behavior data
  • Industry surveys from organizations like Dynamic Yield and SaleCycle track conversion rates and shopping patterns

Data Collection Methods:

  • Large-scale consumer surveys across multiple demographics and regions
  • Analysis of transaction data from major ecommerce platforms
  • Web analytics tracking shopping behavior across millions of websites
  • Financial reports from publicly traded ecommerce companies
  • Government economic data and census information

This multi-source approach ensures the statistics represent real market conditions rather than isolated data points, giving you confidence in making strategic business decisions based on these insights.

15 Ecommerce Usage Statistics That Will Transform Your Business Strategy

Market Size and Growth Statistics

Global Ecommerce Market Explosion

The global ecommerce market is experiencing unprecedented growth. The eCommerce Market worldwide is projected to grow by 7.83% (2025-2029) resulting in a market volume of US$6,478.00bn in 2029. This represents a massive opportunity for businesses of all sizes.

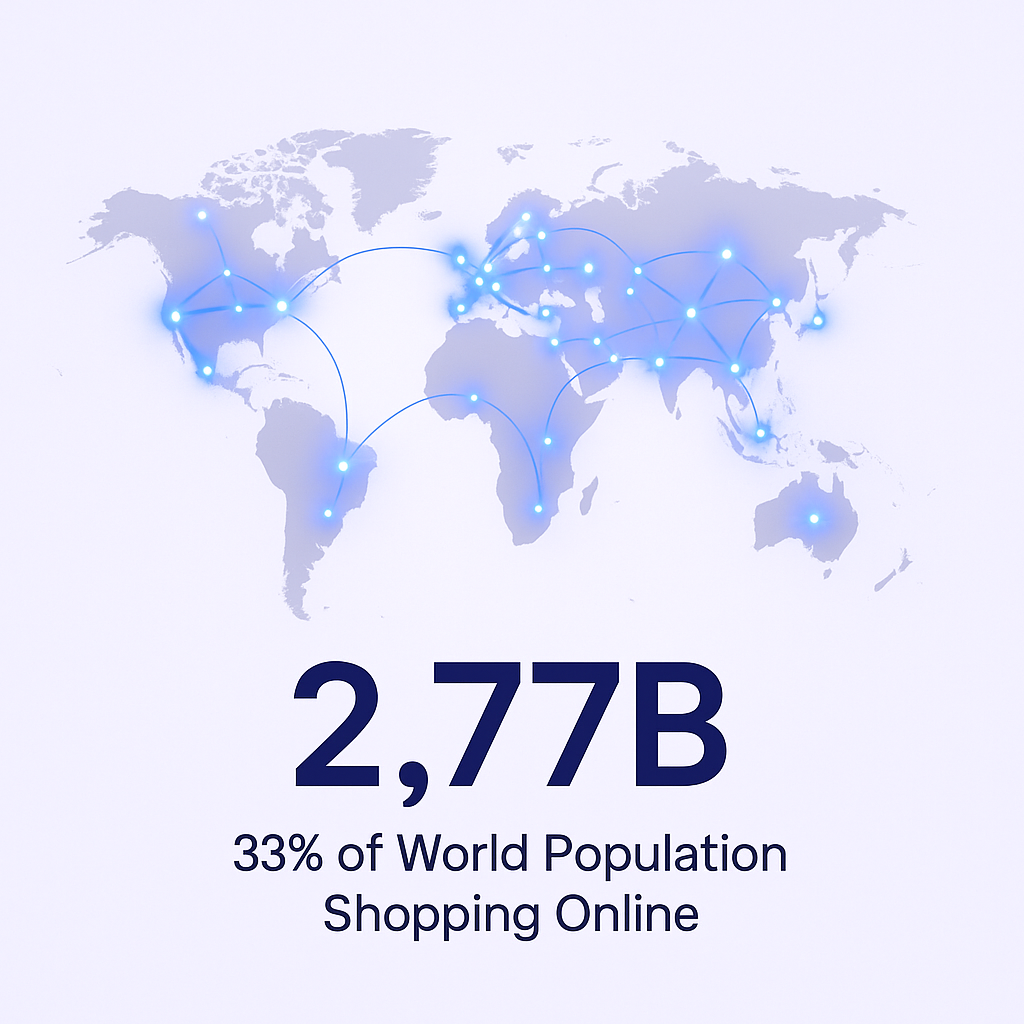
There are 2.77 billion online shoppers globally as of 2025. That means 33% of the world’s population is shopping online, marking a significant shift in consumer behavior. The reach is truly global, with 21% of retail purchases taking place online in 2025, which is the highest to date.


In the United States specifically, the growth trajectory is equally impressive. U.S. e-commerce retail marketplaces made a collective $428.3 billion in 2024, up 11.4% YoY. eCommerce retail marketplace sales are expected to reach $477.7 billion in 2025.

Mobile Commerce Domination

Mobile-First Shopping Revolution

Mobile commerce isn’t just growing – it’s becoming the primary way people shop online. Mobile commerce is set to be responsible for 59% of total retail eCommerce sales, accounting for $4.01 trillion in 2025.

The statistics reveal just how mobile-centric shopping has become:

  • 65.3% of e-commerce site traffic comes from consumers using mobile phones
  • Around 76% of adults purchase using a smartphone in the United States
  • Mobile shopping will increase to $710 billion by 2025, after a growth of 20 percent from 2023

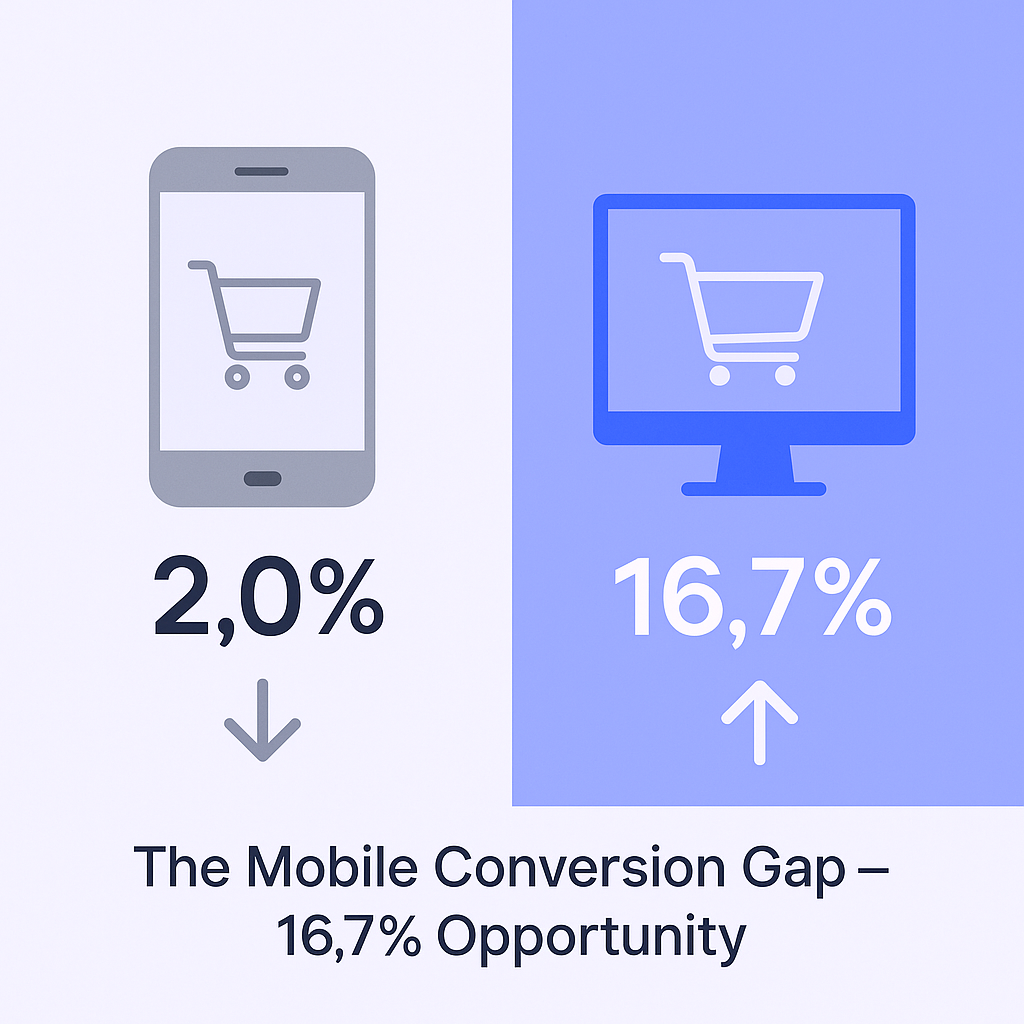
However, mobile shopping presents unique challenges. Only 16% of e-commerce conversions come from shoppers on mobile devices. The average eCommerce conversion rate on mobile phones is 2.0%, 16.7% lower than on desktops. This conversion gap represents a massive opportunity for businesses that can optimize their mobile experience.


📱 Struggling With Low Mobile Conversions?

LinkedIn outbound bypasses conversion issues—reach B2B buyers directly with personalized campaigns that book meetings

Social Commerce Explosion

Social Media as Shopping Destination

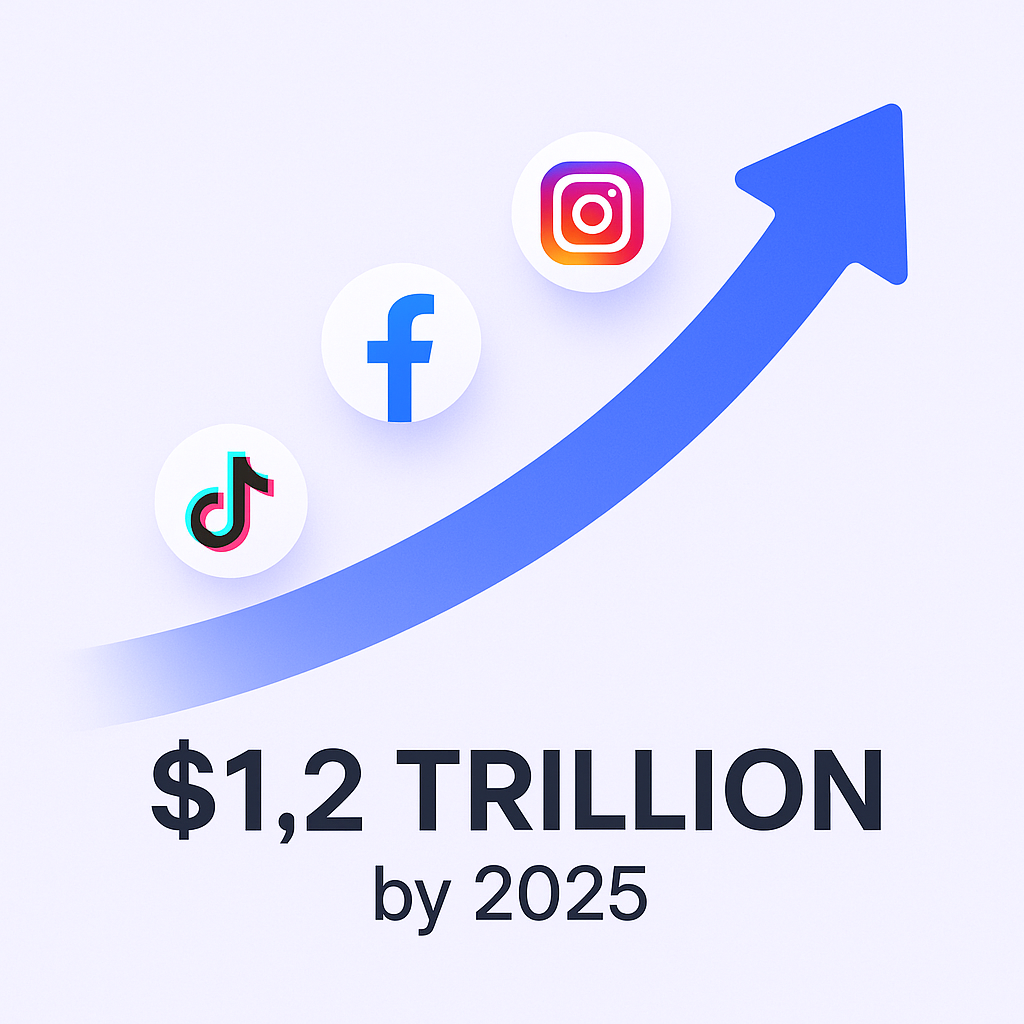
Social commerce is transforming how consumers discover and purchase products. Social commerce is set to become a trillion-dollar market by 2025, with global sales expected to hit $1.2 trillion.


The integration of shopping into social platforms is accelerating rapidly:

  • Seven in ten shoppers say they have already made a purchase via social media, and that same proportion expects these platforms to become their primary shopping destination by 2030
  • 50.6% of social media users in the US have made at least one purchase via social channel in 2025
  • 82% of shoppers say viral trends and social buzz influence their buying decisions

TikTok is leading this social commerce revolution, particularly among younger demographics. Some 43% of Gen Z audiences start their online product searches on TikTok—beating traditional product-discovery methods like Google or Amazon.

Consumer Behavior and Shopping Patterns

Understanding Modern Shoppers

Today’s consumers are digital-first and expect seamless experiences across all touchpoints. 56.1% of internet users worldwide aged 16+ make an online purchase each week, demonstrating the frequency of online shopping behavior.

Regional variations show interesting patterns:

  • South Korean internet users are the most likely (44.4%) to make weekly retail purchases via mobile phone
  • 35.3% of internet users in Mexico make weekly mobile e-commerce purchases
  • 33.7% of Chinese internet users make weekly mobile e-commerce purchases

The generational divide is particularly notable in shopping preferences. 59% of millennials and 61% of Gen Z prefer mobile shopping, while older demographics still lean toward desktop purchases for higher-value transactions.

The Cart Abandonment Challenge

The $18 Billion Problem

Cart abandonment remains one of the biggest challenges facing ecommerce businesses. In 2023, the share of online shopping carts that is being abandoned reached 70 percent for the first time since 2013.

The financial impact is staggering:

  • Ecommerce stores lose as much as $18 billion in revenue every year due to abandoned carts
  • The value of abandoned goods in online shopping carts is around $705 billion in the US alone
  • Lost orders worth $260 billion can be recovered by improving checkout flow and design

💰 Losing $18B to Abandoned Carts?

Skip the checkout friction—LinkedIn outbound connects you directly with qualified buyers ready for conversations

Mobile users face particular challenges, with abandoned cart rates highest on mobile phones at 83.6%, 16.1% higher than desktop.

The primary reasons for abandonment are clear:

  • Extra, unexpected costs are the number one reason for shopping cart abandonments, leading to 48% of abandoned carts
  • 43% of US online shoppers have abandoned a cart within the last 3 months because “I was just browsing / not ready to buy”
  • 57% of B2B buyers do not complete the process since the vendor’s checkout flow takes too long

Artificial Intelligence Integration

AI Transforming Ecommerce

Artificial intelligence is becoming essential for competitive ecommerce operations. 92% of businesses are already using generative AI to enhance the e-commerce experience for more powerful personalization.

Consumer demand for AI features is strong:

  • 7 in 10 shoppers globally want retailers to offer AI-powered shopping features
  • 39% of US consumers state that they have already used generative AI while shopping online
  • 52% of the people said they use voice assistants to search for a product or service

The market projections for AI in ecommerce are substantial. Generative AI’s global market revenue is projected to reach $208.8 billion by 2032, indicating massive investment and adoption ahead.

Platform Market Share and Competition

Understanding Platform Dominance

Amazon continues to dominate the U.S. ecommerce landscape. Amazon accounts for 40.9% of total retail ecommerce sales in the US, representing $540.29 billion in gross sales in 2025.

Search behavior shows platform preferences:

  • Americans discovered Amazon.com via search engine 352 million times per month in May 2025
  • 99.5% of global search traffic is organic (i.e., not the result of paid advertisements)

International markets show different dynamics, with Alibaba having a total market share of 51% in China, handling nearly $1.12 trillion in merchandise sales.

 🎯 Fighting Amazon’s 40.9% Market Share?

Build your own qualified pipeline with LinkedIn outbound targeting, campaign design, and scaling systems

Cross-Border Ecommerce Growth

Global Shopping Without Borders

Cross-border ecommerce is expanding rapidly as consumers become comfortable purchasing from international retailers. The Asia-Pacific region shows particularly strong growth, with Asia-Pacific (APAC) ecommerce market poised for significant growth, with an estimated market size of $4.2 trillion in 2024, expected to reach $6.76 trillion by 2029.

Regional market leadership varies significantly:

  • China’s eCommerce market, valued at $3.19 trillion, holds the top spot as the largest in the world
  • China’s retail sector is rebounding, with retail sales growth showing signs of life as the year progresses

Payment Innovation and Preferences

Digital Payment Evolution

Payment preferences are shifting rapidly toward digital solutions. Digital and mobile wallet payments account for 49% of online transactions worldwide, with mobile wallets like Apple Pay and Google Pay driving 60% of digital transactions worldwide.

The buy-now-pay-later (BNPL) trend is particularly significant:

  • BNPL increases spending—the average amount spent by BNPL users stood at $689
  • eCommerce brands offering BNPL services saw a 2.1% increase in the average conversion rates

Mobile wallet adoption continues to accelerate, with mobile wallet penetration in the U.S. expected to reach over 150 million users in 2025.

Live Shopping and Interactive Commerce

Real-Time Shopping Experiences

Live commerce is emerging as a powerful sales channel, particularly in Asia. The live commerce market in China was $562 billion in 2023 and is expected to increase to $843 billion in 2025.

In the United States, live shopping is gaining traction: In the US, livestreaming was expected to reach $31 billion in 2023, almost triple the size in 2021.

Platform preferences for live shopping show clear leaders:

  • Facebook was the leading platform for live commerce, with 57.8% of global internet users making purchases during live shopping events
  • Instagram was the second most used at 45.8%, followed by TikTok (15.8%) and YouTube (14.4%)

Subscription Commerce Growth

Recurring Revenue Models

The subscription ecommerce model is experiencing explosive growth. The subscription eCommerce sector is anticipated to surpass $450 billion by 2025, a significant leap from its $15 billion valuation in 2019.

This represents a 30x growth in just six years, highlighting the consumer shift toward convenience and predictable purchasing patterns.

B2B Ecommerce Expansion

Business-to-Business Digital Transformation

B2B ecommerce is experiencing rapid digitization. The B2B e-commerce market is valued at $32.11 trillion as of 2025 and is expected to grow at a CAGR of 14.5%, reaching $36.16 trillion by 2026.

This growth rate significantly outpaces B2C ecommerce, indicating that business buyers are rapidly adopting digital purchasing processes.

Tap Into $32.11T B2B Market

LinkedIn outbound reaches decision-makers in this growing market with complete targeting and campaign systems

7-day Free Trial |No Credit Card Needed.

Sustainability and Conscious Commerce

Environmental Impact on Shopping Decisions

Consumer consciousness around sustainability is influencing purchasing decisions. 80% of consumers surveyed said they are more likely to trust companies that back up their sustainability claims with publicly shared data.

The impact on brand loyalty is significant, with 40% not comfortable purchasing products from companies that are not actively tracking toward sustainability goals.

Technology Adoption in Shopping

Augmented Reality and Immersive Experiences

Technology adoption is accelerating across the shopping experience. 71% of the consumers said they would purchase more frequently if AR were available, indicating strong demand for immersive shopping technologies.

Voice commerce is also gaining traction, with 37% of global shoppers – and nearly half of social commerce users – making purchases hands-free.

Fulfillment and Logistics Evolution

The Infrastructure Behind Growth

The logistics supporting ecommerce growth represent a massive industry. The e-commerce fulfillment service global market value is $140.1 billion in 2025, up 13.2% year-over-year, with projections indicating global revenue for e-commerce fulfillment will exceed $272 billion by 2030.

Outsourcing is common, with 60% of online retailers at least partially outsourcing fulfillment services; among them, 20% outsource the entire fulfillment process.

Conclusion

The ecommerce landscape in 2025 is defined by mobile-first shopping, social commerce integration, and AI-powered personalization. With 2.77 billion online shoppers globally and social commerce reaching $1.2 trillion, businesses that adapt to these trends will capture the biggest share of this growth.

The data reveals clear opportunities: optimize for mobile experiences, integrate social selling strategies, leverage AI for personalization, and focus on reducing cart abandonment through better checkout experiences. Companies that embrace these insights and act on them will be best positioned to capitalize on the continued explosive growth of ecommerce.

The future belongs to businesses that understand their customers’ digital journey and meet them where they shop – whether that’s on mobile, social platforms, or through AI-powered recommendations. Use these statistics as your roadmap to ecommerce success in 2025 and beyond.

Sources: Data compiled from Statista, eMarketer, U.S. Census Bureau, Baymard Institute, Shopify, Dynamic Yield, and other authoritative industry sources. All statistics are from 2024-2025 reports unless otherwise noted.


Scale Your Ecommerce Sales With LinkedIn

Target 2.77B+ decision-makers with precision outbound campaigns that convert better than paid ads

Segmentation That Actually Converts

LinkedIn outbound targets precise demographics with strategic campaign design and scaling methods

How to Build a High-Converting B2B Sales Funnel from Scratch on LinkedIn ​