

The Impact is Massive:
- Phantom Opens: Every email delivered to Apple Mail users with MPP enabled registers as “opened”—even if never viewed
- Inflated Metrics: Average open rates have nearly doubled for some marketers, but don’t reflect real engagement
- Hidden User Data: Apple’s proxy servers mask users’ true IP addresses and device information
This privacy shift forces us to interpret email client statistics differently. The numbers we see today blend real opens with Apple’s automated pre-loading, making the data more complex but still valuable for strategic decisions.
13 Email client statistics to know
Now let’s explore the data that defines today’s email landscape. These email client statistics will reshape how you approach your campaigns, from design choices to timing strategies.
The Dominant Players: Apple and Gmail Rule Everything
- Apple Mail commands a staggering 58% of the email client market share
Apple Mail leads the global email client market with approximately 56-58% market share, making it the undisputed king of email clients. This dominance stems from being pre-installed on every iPhone, iPad, and Mac—creating a massive default user base.
- Gmail captures 29-32% market share as the strong second
Gmail holds between 25.89% and 32% of the email client market, establishing itself as the clear runner-up. While Gmail is incredibly popular as an email provider with over 2.5 billion users, its client market share remains secondary to Apple’s ecosystem integration.
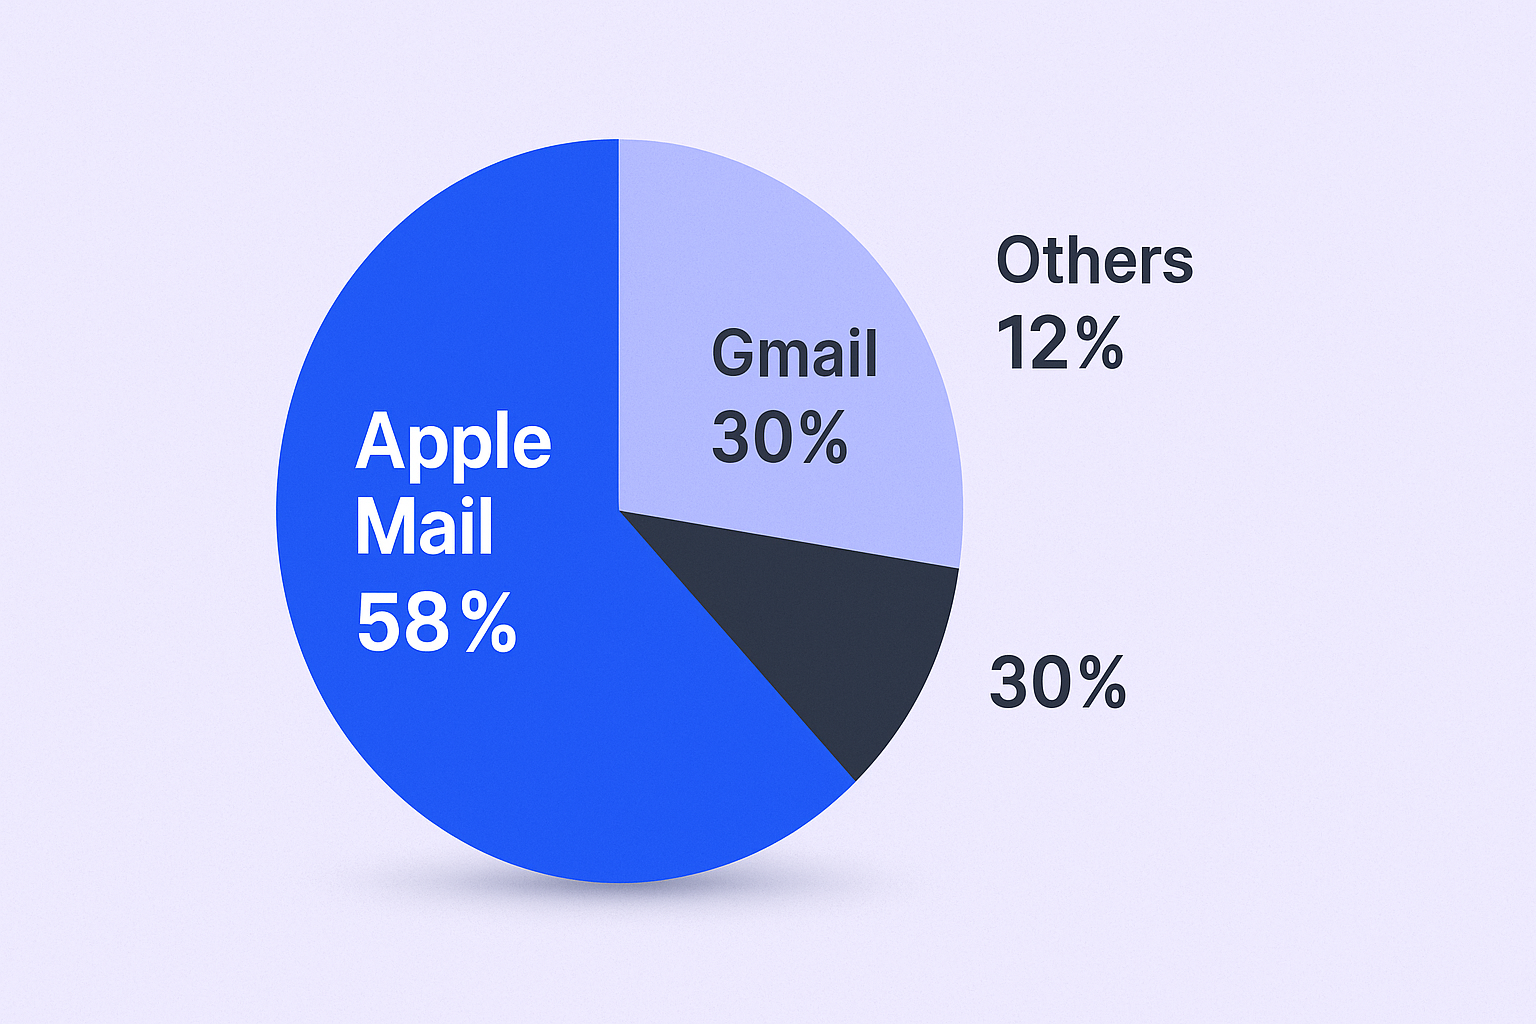
Key Insight: These two platforms control nearly 90% of the market. Your email success literally depends on how well your messages perform in Apple Mail and Gmail environments.
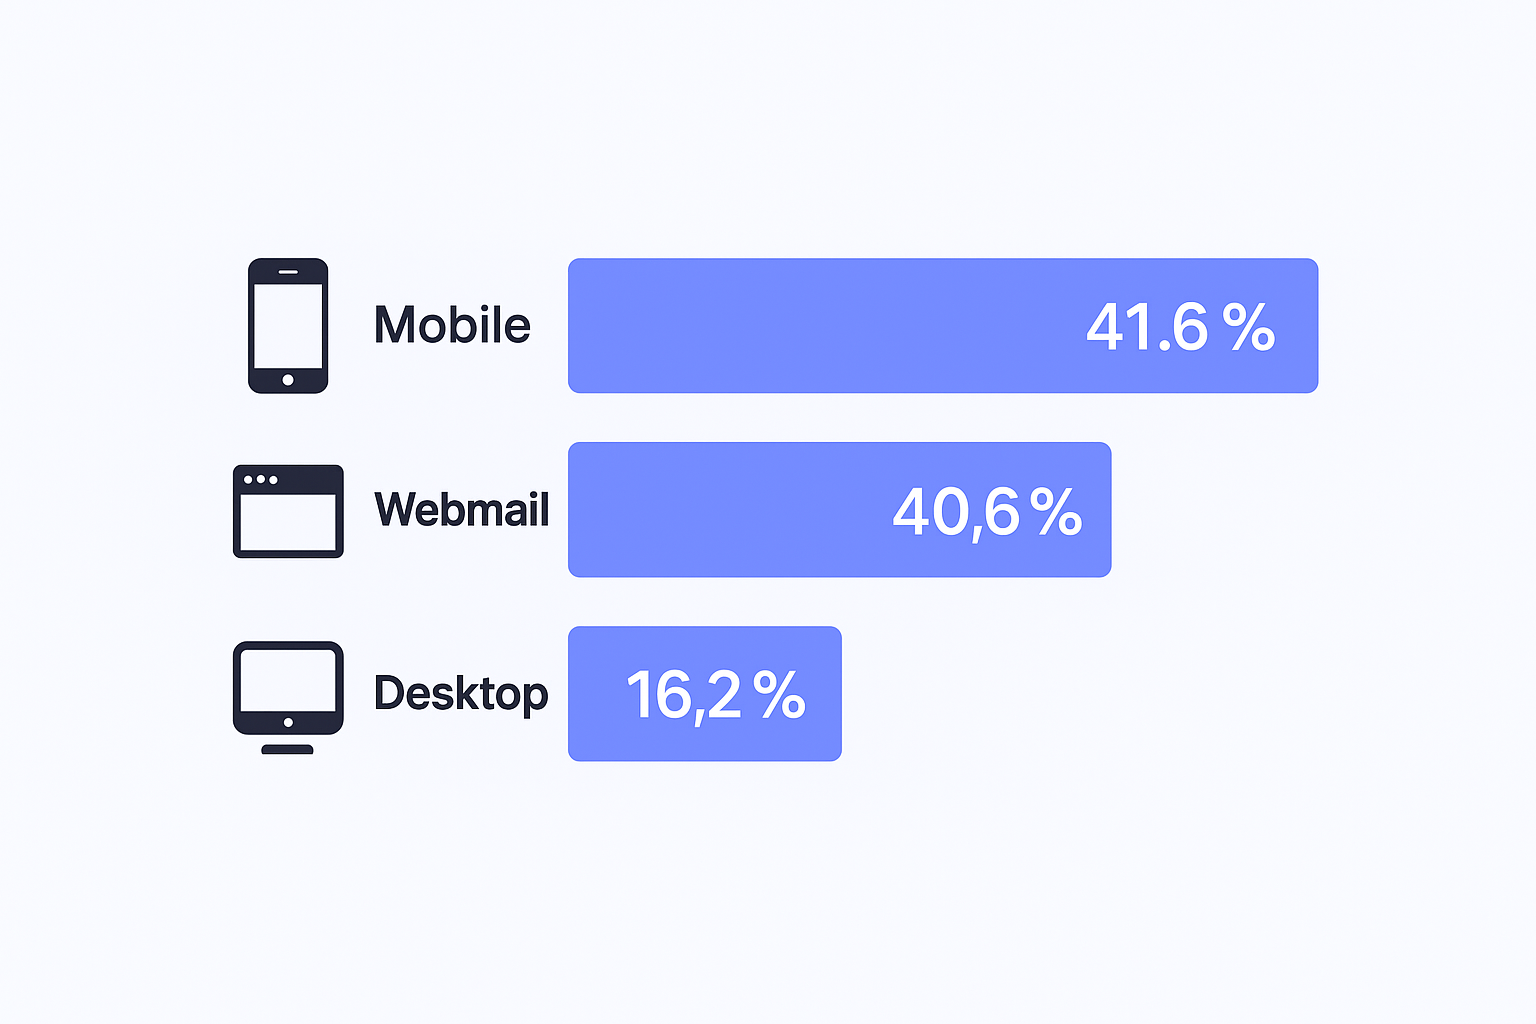
Mobile Dominance: Your Desktop Preview Doesn’t Matter
- Mobile clients account for 41.6% of all email opens
Mobile email opens made up 41.6% of all email opens, with webmail (like Gmail.com accessed through browsers) close behind at 40.6%. Traditional desktop email clients lag far behind at just 16.2%.
- iPhone dominates mobile with an incredible 90.5% market share
Within mobile email reading, the iPhone holds a massive 90.5% share. This means when someone opens your email on their phone, it’s almost guaranteed to be on an iPhone using Apple Mail.
- 84% of Gmail users access their email via mobile devices
84.08% of Gmail users access their emails through their mobile devices, while just 15.92% prefer to access their Gmail on a desktop. Even Gmail, primarily accessed through web browsers, sees overwhelming mobile usage.
Assume every email you send will be opened first on an iPhone. If your email isn’t optimized for a small, vertical screen, it’s optimized for the trash bin
The Privacy Revolution’s Impact
- Apple’s Mail Privacy Protection accounts for over 56% of tracked “opens”
Apple’s devices using client Mail Privacy Protection (MPP) were the most popular on the global market – making up a share of 55 percent opens during the year. This massive percentage reflects MPP’s automatic pre-fetching rather than genuine user engagement.
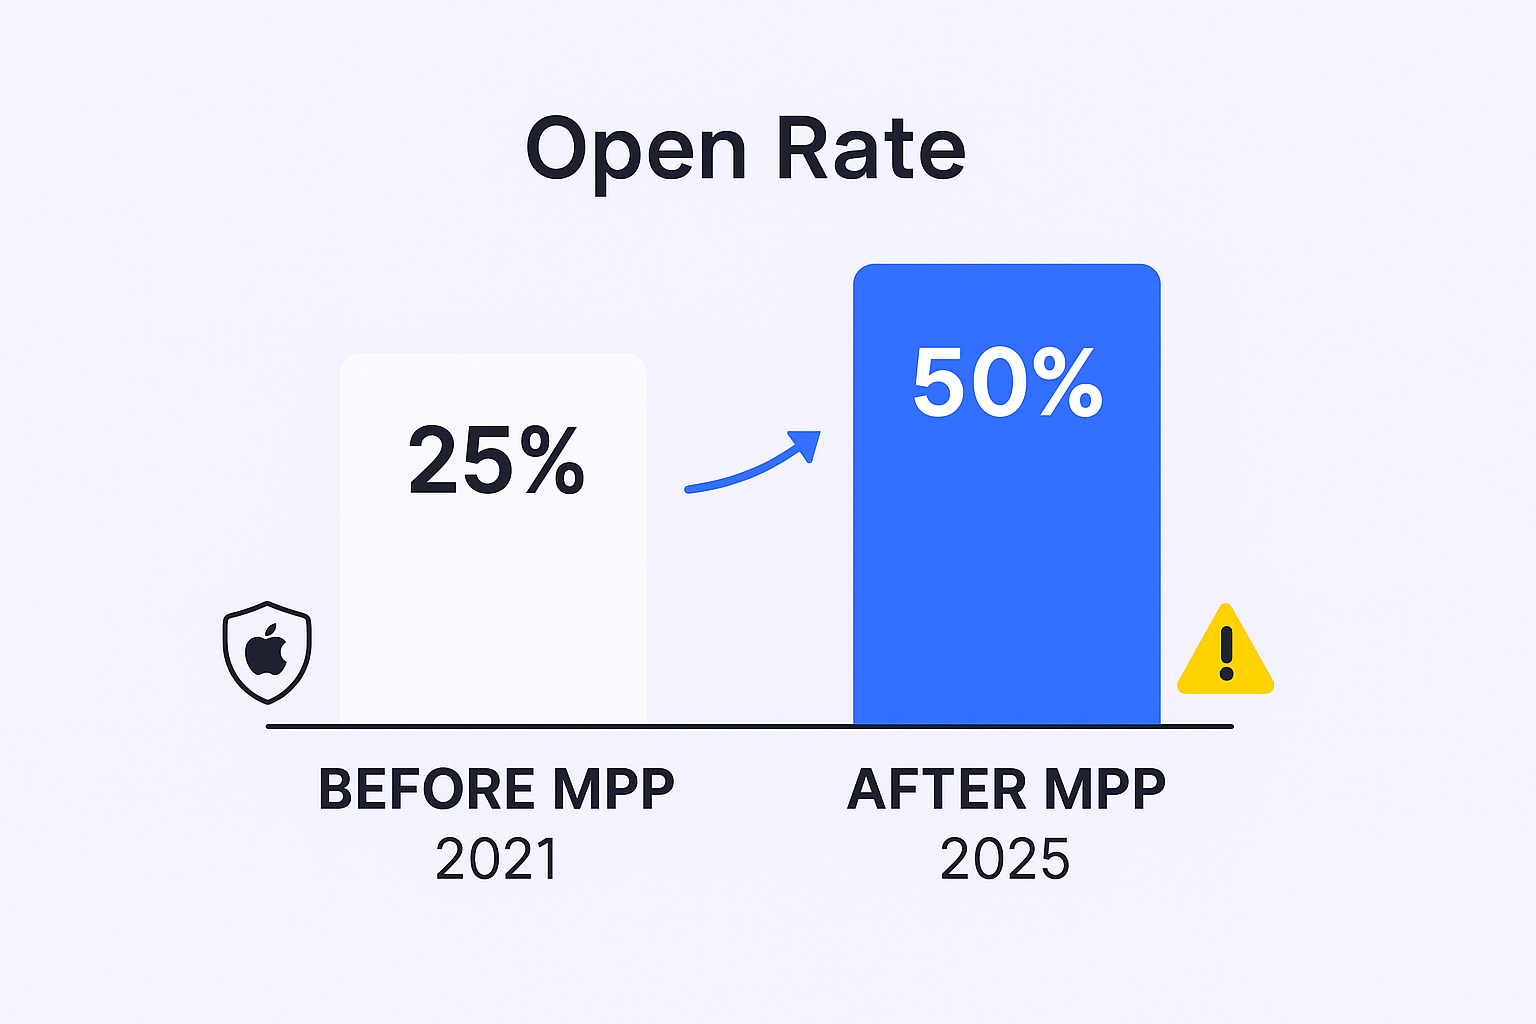
- Email open rates have nearly doubled since MPP’s introduction
Some marketers report seeing their open rates nearly double compared to pre-MPP levels, though this inflation doesn’t indicate increased reader interest—it’s Apple’s servers “opening” emails automatically.
