🎉Find Prospects and Send Cold Emails & LinkedIn Outbound | All in One Place

LinkedIn Traffic Statistics 2026: The Numbers That Actually Matter

Table of Contents

LinkedIn Traffic Statistics

  • 1.77 billion monthly visits in February 2026 – representing roughly 3-5 visits per active user every month
  • Only 310-533 million monthly active users – representing barely 25-45% of the 1.2 billion registered members
  • Daily active users sit between 134.5-161.5 million – meaning only 13-15% of all profiles actually check the platform on any given day
  • Average session lasts 7-8 minutes – the “utility timeframe” where people scan, read, check messages, and move on
  • Direct traffic accounts for 67-73% of all visits – people typing “linkedin.com” directly or opening the app, no search needed
  • 57-70% of users access the platform on mobile – representing the majority and requiring mobile-optimized messaging strategies
  • United States dominates with 234 million users and 31-32% of web traffic – though emerging markets offer less saturated opportunities
  • 25-34 age group is the largest demographic at 47-50% – millennials holding majority of Manager to VP-level roles
  • 53-54% of US LinkedIn users earn over $100,000 annually – representing affluent, high-authority professionals with purchasing power
  • Video uploads increased 34% year-over-year – with video posts getting 5x more engagement than static posts
  • Live video generates 24x more engagement – than pre-recorded content, showing massive opportunity for real-time connection
  • Only 25% of users interact with brand content daily – though 78% consume content for industry news, revealing “dark funnel” lurkers
  • 89% of B2B marketers use LinkedIn for lead generation – with 62% reporting it produces leads effectively, more than double other channels
  • LinkedIn is 277% more effective for lead generation than Facebook or X – showing massive performance advantage for B2B marketing
  • Personalized connection requests get 45-50% acceptance rate – versus only 15-20% for generic blank requests, proving personalization’s critical importance
  •  


Here’s what nobody tells you about LinkedIn.

While everyone’s obsessing over the “1.2 billion users” headline, the real story is buried in the data. And if you’re trying to reach decision-makers on the platform, understanding these linkedin traffic statistics could be the difference between wasting your time and actually booking meetings.

Let me break down what’s really happening on LinkedIn in 2025.

The Reality Check: Total Users vs. Active Users LinkedIn

LinkedIn has 1.2 billion registered members. That’s the number everyone throws around.

But here’s the twist: only 310-533 million are monthly active users. That’s barely 25-45% of the total membership.

Even more telling? Daily active users sit between 134.5-161.5 million. That means on any given day, roughly 13-15% of all profiles are actually alive and checking the platform.


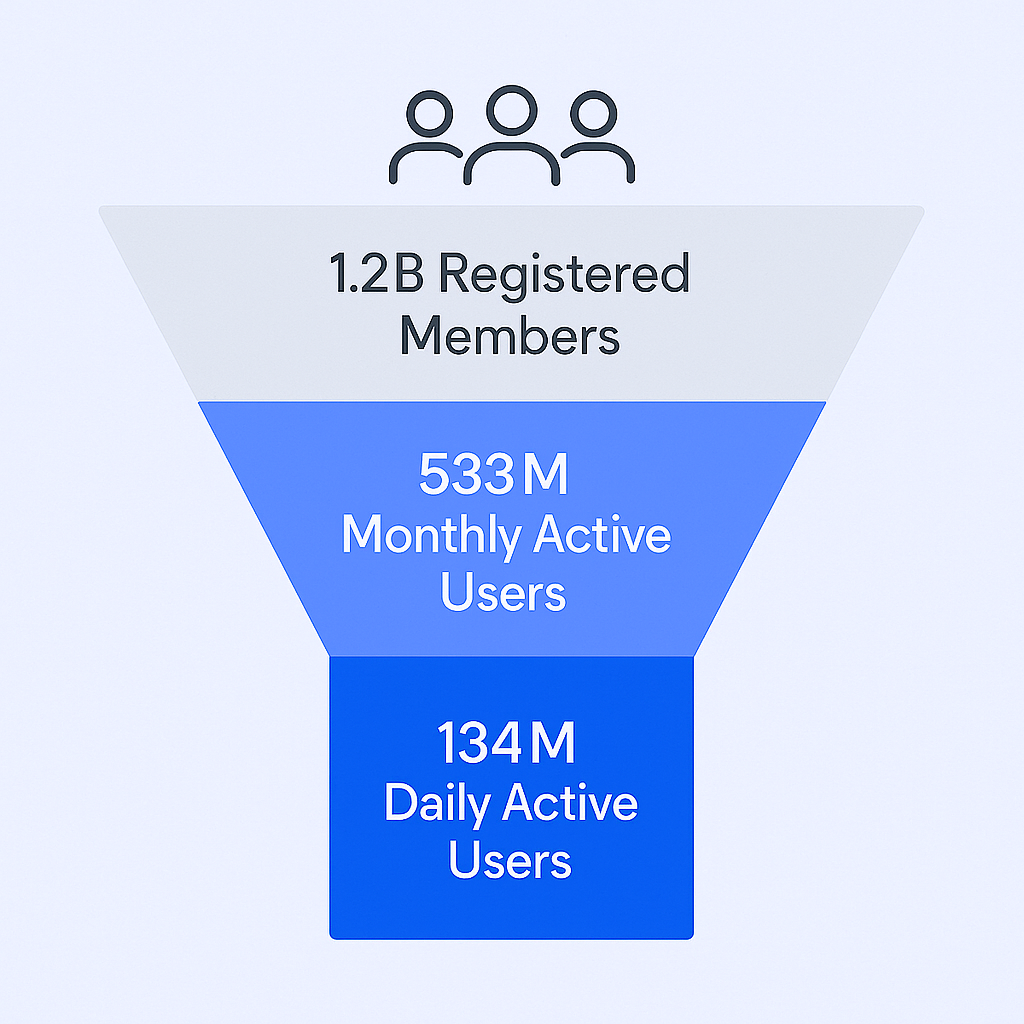
Why this matters: If you’re prospecting on LinkedIn, you’re not actually fishing in a pool of 1.2 billion people. You’re fishing in a pool of 134 million daily users. The rest are ghost accounts collecting digital dust.

The takeaway? Stop celebrating massive connection numbers. Start focusing on who’s actually online.

LinkedIn Traffic: 1.77 Billion Monthly Visits

In February 2025 alone, LinkedIn.com pulled in 1.77 billion monthly visits.

Do the math: that’s roughly 3-5 visits per active user every month. This isn’t a “check it once and forget it” platform anymore.

The average session lasts 7-8 minutes. Not 2 hours like Instagram. Not 30 seconds like TikTok. Exactly long enough to scan a feed, read a post, check messages, and move on.

This is the “utility timeframe.” People aren’t doom-scrolling. They’re working.

Traffic Sources That Matter

Here’s where things get interesting for your personal brand:

  • Direct traffic: 67-73% of all visits. People are typing “linkedin.com” directly or opening the app. No search needed.
  • Organic search: 21-29% of traffic. When someone Googles your name, your LinkedIn profile is likely result #1 or #2.
  • Paid search: Less than 1%. The platform doesn’t need ads to drive traffic.

The brutal truth: If your LinkedIn profile isn’t optimized, you’re bleeding traffic that Google is already sending you. Fix your headline. Fill out your experience. Make the landing page worth clicking.

Mobile vs. Desktop: The Split That Changes Everything

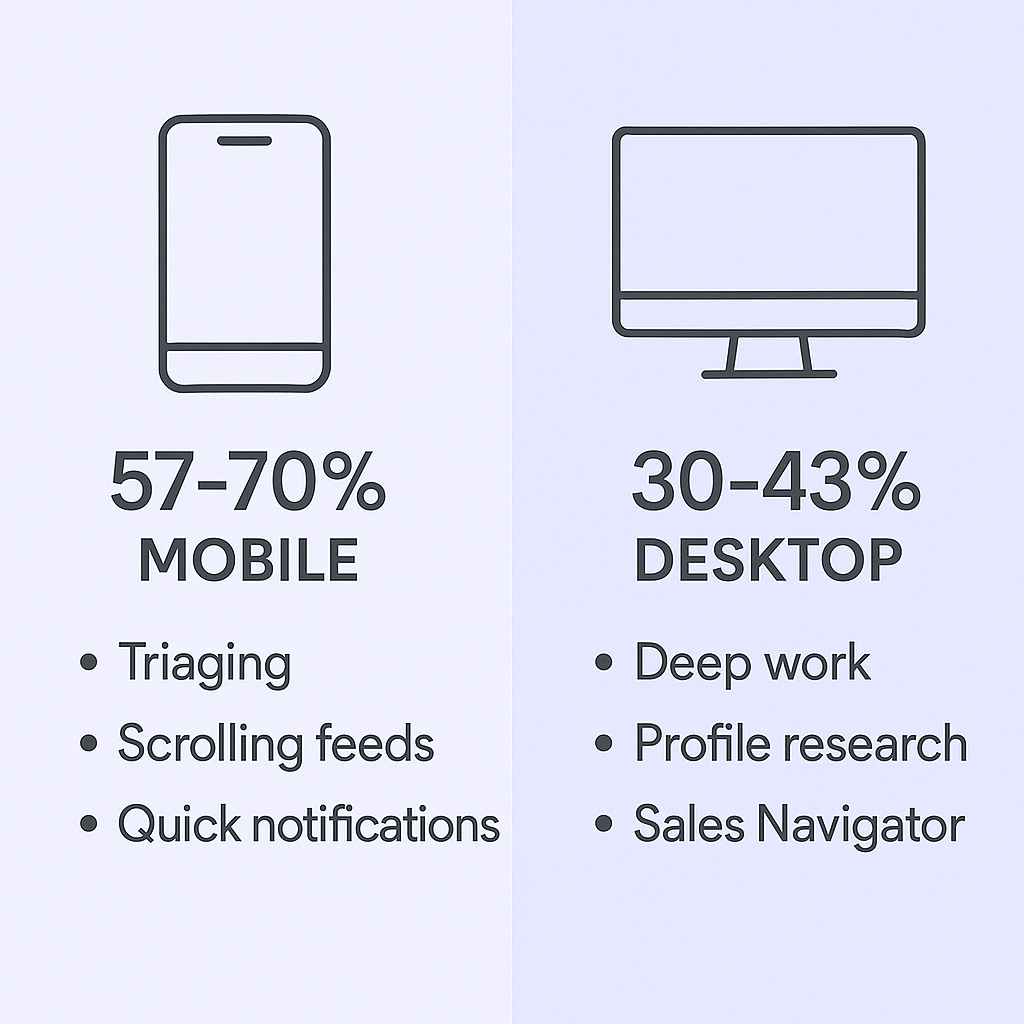
57-70% of linkedin users now access the platform on mobile. That’s the majority.

But here’s what most people miss: mobile users are triaging. They’re:

  • Scrolling the feed during coffee breaks
  • Checking notifications between meetings
  • Accepting or ignoring connection requests on autopilot

Desktop users are deep-working. They’re:

  • Reading long-form articles
  • Actually using Sales Navigator
  • Reviewing profiles in detail
  • Applying for jobs or researching companies


The dual-mode reality: Your prospects see your message on mobile in the morning (where they decide whether to care), then engage on desktop at lunch (where they actually respond).

Action step: Write your messages for mobile skimmers. Keep paragraphs short. Use line breaks. Make it scannable. Because if it doesn’t survive the mobile triage, your desktop-optimized pitch never gets seen.

Geographic Traffic Breakdown

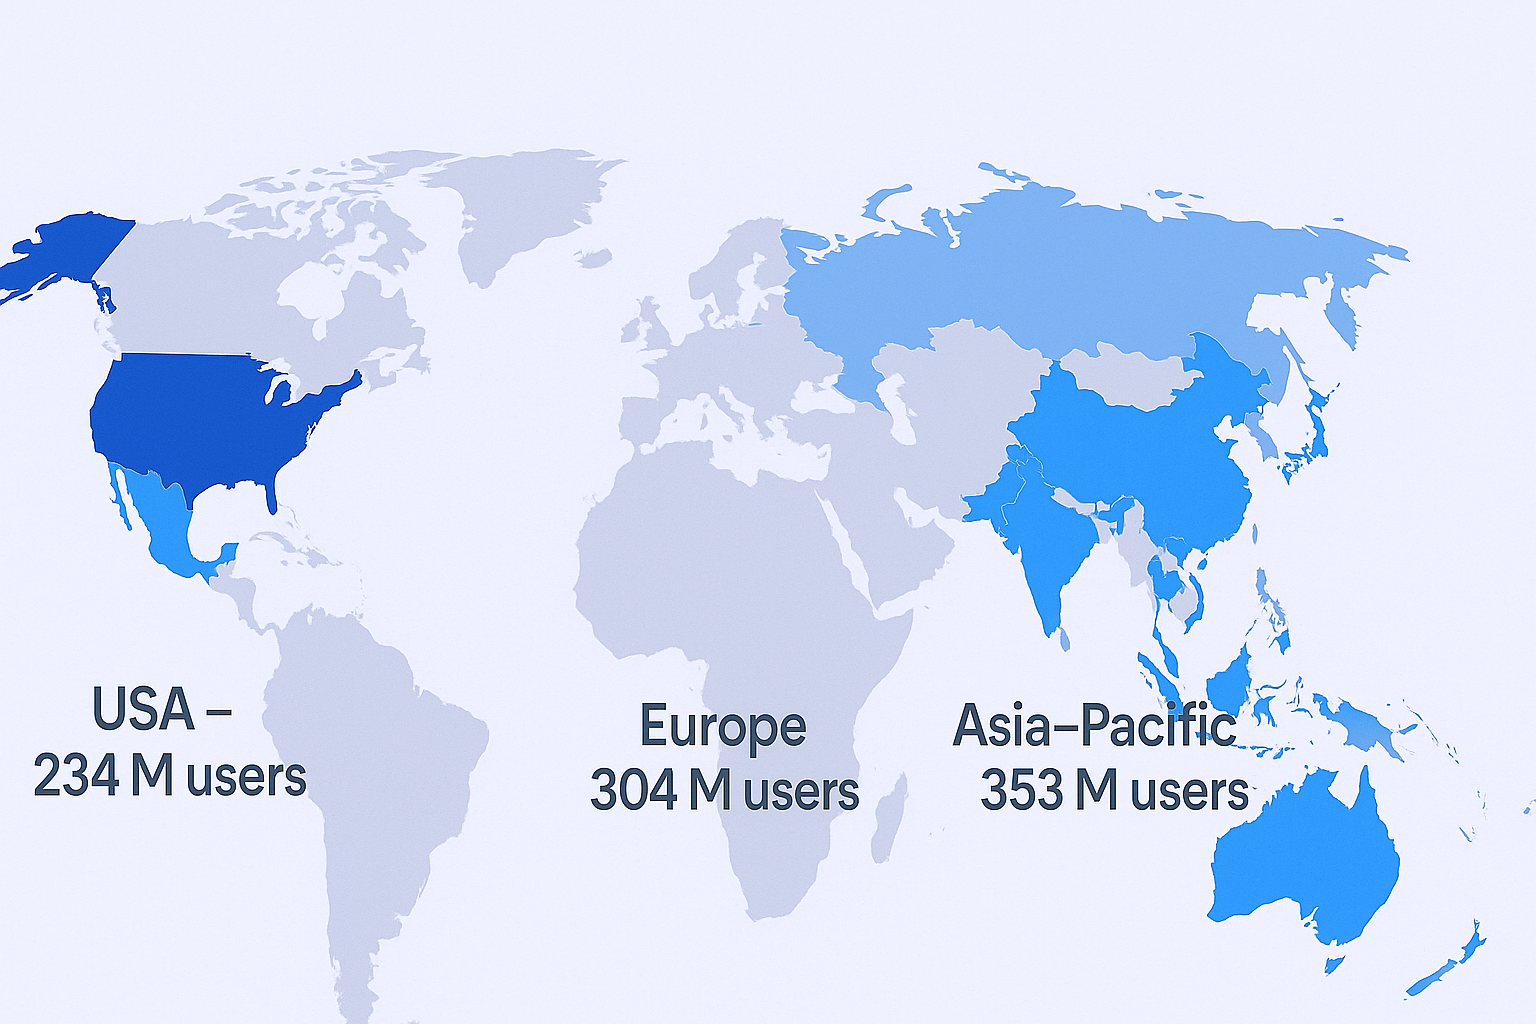
United States dominates with 234 million users and 31-32% of all web traffic. But here’s the surprise:

India is the second-largest market with 148-161 million users and 7-9% of traffic share. Europe collectively holds 304 million users. Asia-Pacific leads with 353 million members.

The pattern? Emerging markets have huge user numbers but lower traffic intensity. Translation: less inbox noise, potentially higher open rates for early movers.

If you’re only prospecting in the US, you’re competing in the most saturated market. Smart money is expanding territory before everyone else catches on.


Who’s Actually On LinkedIn? (Demographics)

The platform isn’t a “Rolodex for Boomers” anymore. The data tells a different story.

Age Distribution

The 25-34 age group is the largest demographic at 47-50% of the user base. Millennials (29-44 years old) now represent 35.8% of US users and hold the majority of Manager to VP-level roles.

Gen Z (18-24) accounts for 21-29% of users and they’re bringing mobile-first, video-centric, jargon-skeptical energy.

What this means for your messaging: Ditch the “Dear Sir/Madam” formality. The decision-makers you’re targeting grew up with instant messaging. They want conversational, authentic, direct communication—not corporate speak.

Income & Decision-Making Power

Here’s why LinkedIn consistently outperforms other social media platforms for B2B:

53-54% of US LinkedIn users earn over $100,000 annually. The platform has 65 million decision-makers and 10 million C-level executives. Even more impressive: 4 out of 5 linkedin members drive business decisions.

This concentration of affluent, high-authority professionals is exactly why bb marketing strategies center around LinkedIn. You’re not just reaching people—you’re reaching people who can actually sign contracts.

The committee effect: You don’t need to just reach the CEO. Directors, VPs, and Heads of Department all have purchasing authority. The entire buying committee is visible and accessible.

Gender & Leadership

Globally, the platform skews 56.9% male and 43.1% female. But in leadership roles, women hold 49% of positions on the platform—near parity.

Content Performance: What Actually Works

Video is exploding. Video uploads increased 34% year-over-year, and video posts get 5x more engagement than static posts. Live video generates 24x more engagement.

But here’s the paradox: users still interact most with text posts, followed by images. Native documents (PDF carousels) generate 3x more engagement than other formats.

The content matrix:

  • Video (under 30 seconds): Best for awareness and stopping the scroll
  • Text & images: Best for authority and conversion
  • Document posts: Best for deep engagement signals

The Silent Majority

Only 25% of users interact with brand content daily. But 78% consume content to keep up with industry news, and 73% discover new ideas through their feed.

The dark funnel effect: Most buyers are lurkers. They’re reading your posts, judging your expertise, and never hitting “like.” A post with 10 likes can still drive revenue if 3 of those silent viewers later accept your connection request because they recognized your name.

Timing: When To Post for Maximum Reach

Best days: Tuesday, Wednesday, Thursday.
Best times:

  • 10 AM – 12 PM: The productivity peak. People are online, caffeinated, focused.
  • 1 PM – 3 PM: The post-lunch browse. Checking feeds before diving back into work.

Worst times: Friday afternoons (everyone’s checked out), Monday mornings (inbox clearing mode), weekends (low activity).

Pro tip: The algorithm rewards early engagement. If your post gets traction in the first 60 minutes, it gets distributed wider. Post when your audience is actually online.

Lead Generation Performance: LinkedIn vs. Everything Else


📊 Know the Stats. Missing the Strategy?

We build LinkedIn outbound campaigns that convert data into 15-25% response rates

89% of B2B marketers use LinkedIn for lead generation. That’s not because everyone else is doing it. It’s because 62% say it actually produces leads effectively—more than double any other social channel. For bb marketing professionals, this performance gap is impossible to ignore.

Response Rates That Matter

🎯 Targeting 134M Active Users Daily

Our complete LinkedIn outbound system handles targeting, messaging, and scaling for you

LinkedIn InMail averages a 10.3% response rate, with top performers hitting 18-25%. Cold email averages 5.1%.

LinkedIn is rated 277% more effective for lead generation than Facebook or X (Twitter).

The trust architecture advantage: A cold email is isolated—easily dismissed as spam. A LinkedIn message is anchored to a profile. Prospects can see your face, read your experience, view mutual connections, and check your content. Transparency reduces risk, which increases response rates.

Connection Request Strategy

Personalized connection requests get a 45-50% acceptance rate. Generic blank requests? 15-20%.

The data is clear: a relevant note performs better than no note. The “blank request” crowd argues it’s less salesy, but the numbers don’t lie.

Benchmark targets for a healthy outreach campaign:

  • Connection acceptance: >30%
  • Reply rate (after acceptance): >10%

InMail Open Rates

For those using Sales Navigator, InMail open rates can hit 57.5%—vastly outperforming email marketing’s ~21% average.

Industry-specific InMail CTR benchmarks:

  • Retail: 0.8% (highest)
  • Transportation/Logistics: 0.67%
  • Healthcare: 0.58%
  • Software & Internet: 0.39% (lowest—reflects noise/saturation)

If you’re in SaaS, your competition is brutal. Generic outreach dies instantly. Personalization has to go deeper than “I see you work at [Company].”

The Cold Email Connection

🚀 Multi-Channel Done Right

LinkedIn outbound + email sequences + verified data—we manage the entire revenue engine

Here’s where LinkedIn intersects with your broader outreach strategy.

LinkedIn identifies who’s active. Sales Navigator’s “Posted in last 30 days” filter is gold—it separates living accounts from dead ones.

But LinkedIn restricts contact info. You can see who to target, but you often can’t get their email or phone without external tools.

The modern workflow:

  1. Identify targets on LinkedIn (using activity filters)
  2. Enrich data via Apollo or ZoomInfo to get email/phone
  3. Sequence via multi-channel: email + LinkedIn + phone touches

Why this works: 89% of top-performing teams use LinkedIn alongside a separate data provider because LinkedIn data is current (user-generated) while external tools provide verified contact details.

And when you’re ready to scale your email outreach alongside your social selling efforts, platforms like Salesso give you the email verification, warming, and automation needed to make sure your messages actually land in inboxes—not spam folders.

LinkedIn Advertising Costs (For Context)

If you’re not running ads, this number still matters:

Average cost-per-click: $5.58 globally.
IT executives: $7.90 CPC.
Finance professionals: $6.90 CPC.

Why this matters: If a click from an IT Director costs marketing $7.90, then every time you get that same Director to accept a connection request and click a link in your profile, you’ve generated ~$8 of media value—for free.

Over thousands of connections, your organic media value as a well-networked professional is worth tens of thousands of dollars.

Creator Mode & Personal Branding

Posts from accounts with Creator Mode turned on see a 30% increase in engagement. Users who activate it see a 50% surge in follower count.

Even more telling: 59% of B2B decision-makers prefer creator content on LinkedIn over other platforms, and 82% say this content influences purchasing decisions.

The shift: Buyers trust people (creators) more than corporate brand pages. If you’re in sales, marketing, or business development, your personal brand is now your competitive advantage.

This trend is reshaping bb marketing entirely. The most successful professionals aren’t hiding behind company logos—they’re building personal authority that prospects can connect with before the first sales conversation even happens.

Action step: Turn on Creator Mode. Start creating. Your prospects are already consuming content to make buying decisions—they’re just not consuming yours yet.

💼 Access 65M Decision-Makers Without the Guesswork

We design LinkedIn outbound campaigns targeting active buyers—no wasted connections or ghost accounts

7-day Free Trial |No Credit Card Needed.

Conclusion

LinkedIn traffic statistics for 2025 paint a clear picture: the platform is maturing into the central hub for B2B decision-making.

1.77 billion monthly visits. 57-70% mobile usage. 310-533 million monthly active users. 89% of B2B marketers choosing it for lead generation. 10.3% InMail response rates crushing email’s 5.1%.

But the real insight isn’t in the numbers—it’s in the behavior they reveal.

Prospects are triaging on mobile and engaging on desktop. They’re lurking more than liking. They’re trusting personal brands over corporate pages. And they’re increasingly accessible if you know where to look and how to message.

The platform rewards precision over volume. Quality over quantity. Relevance over reach.

The 2025 playbook:

  • Optimize for mobile-first messaging (short, scannable, direct)
  • Use video strategically (stop the scroll, build trust, humanize your brand)
  • Focus on active users (filter for “posted in last 30 days”)
  • Personalize everything (generic outreach dies in 2025)
  • Build your personal brand (creators win the trust game)
  • Leverage multi-channel workflows (LinkedIn + email + phone = results)

LinkedIn is the most expensive place to be lazy, but the most profitable place to be smart.

The data confirms the Economic Graph is open for business—but only for those who understand the rules of the road.

Whether you’re using LinkedIn for prospecting, lead generation for B2B, or building thought leadership, combining it with the right business development tools creates a powerful multi-channel engine that actually converts.

FAQs

What are the current linkedin statistics for 2025?

LinkedIn has 1.2 billion registered members but only 310-533 million monthly active users and 134.5-161.5 million daily active users. The platform receives 1.77 billion monthly visits with an average session duration of 7-8 minutes.

What percentage of LinkedIn traffic comes from mobile?

57-70% of LinkedIn traffic now comes from mobile devices, making mobile optimization critical for content and messaging strategies. Desktop still accounts for 30-43% and is used primarily for deep work activities

How does LinkedIn compare to other social media platforms for B2B marketing?

LinkedIn is 277% more effective for lead generation than Facebook or X. 89% of B2B marketers use it for lead generation, and 62% report it produces leads effectively. LinkedIn InMail has a 10.3% response rate compared to cold email's 5.1%.

What are the best times to post on LinkedIn in 2025?

The best times are Tuesday through Thursday, 10 AM-12 PM (productivity peak) and 1 PM-3 PM (post-lunch browse). Avoid Friday afternoons, Monday mornings, and weekends for optimal engagement.

How many decision-makers are on LinkedIn?

LinkedIn has over 65 million decision-makers and 10 million C-level executives. More importantly, 4 out of 5 linkedin members drive business decisions, meaning the buying committee is visible and accessible beyond just C-suite contacts

How to Build a High-Converting B2B Sales Funnel from Scratch on LinkedIn

How to Build a High-Converting B2B Sales Funnel from Scratch on LinkedIn ​