🎉Find Prospects and Send Cold Emails & LinkedIn Outbound | All in One Place

LinkedIn Post Statistics 2026: Engagement Data That Matters

Table of Contents

LinkedIn Post Statistics 2026

LinkedIn engagement rates climbed from 4.48% (January 2024) to 5.42% (December 2024) – representing a 21% increase while other social platforms are declining

Corporate brand pages saw 8.3% decline in engagement during first half of 2025 – even as overall platform engagement rose, showing algorithm penalizes corporate content

X (Twitter) engagement rates cratered by 48% – while LinkedIn maintained 3-3.5% average engagement for B2B content, making it the strongest business platform

Multi-image carousel posts: 6.60% average engagement – highest-performing format due to dwell time from swiping through slides

Native PDF documents: 6.10% average engagement – second-best format, performing nearly as well as carousels with higher save rates

Video content: 5.60% average engagement – up from 4.00% in previous years, but vertical video (4:5 or 9:16) dramatically outperforms horizontal

Videos under 30 seconds have 200% higher completion rate – retention drops sharply after 90 seconds, making brevity critical

Poll posts: 4.40% average engagement – doubled engagement from 2023, offering one-click participation with strategic voter list access

Responding to comments within first hour boosts visibility by up to 35% – “comment velocity” signals live conversation, prompting algorithm to expand reach

Timing delivers 30-50% boost in initial engagement – Tuesday-Wednesday 8 AM-2 PM are peak windows, with 10:45 AM optimal micro-window

Saturday mornings (9-11 AM) show surprisingly high engagement for personal profiles – C-level executives consume thought leadership with less feed competition

LinkedIn InMail/DM: 10-15% response rate vs cold email’s 1-5% – 200-300% better performance for personalized LinkedIn outreach

LinkedIn 277% more effective than other social platforms for lead generation – significantly outperforms Facebook, Twitter, and Instagram for B2B

Prospects engaging with LinkedIn content are 67% more likely to respond to follow-up email – “warm-up effect” bypasses psychological spam filter through familiarity

Integrated LinkedIn + email approach sees 3x higher conversion rates – than using either channel in isolation, combining credibility with scalability

You’re posting on LinkedIn every week. Maybe even every day.

But here’s the brutal truth: most of those posts are disappearing into the void. You’re spending hours crafting content that gets buried within minutes, never reaching the people who actually matter for your business.

The problem isn’t your ideas. It’s that LinkedIn’s algorithm has become shockingly sophisticated in 2025, and most people are still playing by 2022 rules. The engagement rates between someone who understands the current algorithm and someone who doesn’t? It’s not 10% better. It’s 6x better.

This article breaks down the LinkedIn post statistics that actually move the needle. We’re talking about 6.60% engagement rates for carousels versus 4.85% for standard images. The difference between posting at 10:45 AM versus 4:00 PM. Why personal profiles are crushing corporate pages by double digits.

By the end, you’ll know exactly which content formats LinkedIn’s algorithm prioritizes, when to post for maximum visibility, and how to structure your content to keep people’s eyes locked on your message.

LinkedIn Post Statistics

Let’s start with what’s actually working right now on LinkedIn.

Overall Engagement is Rising (But Not for Everyone)

Here’s the first critical stat: LinkedIn engagement rates climbed from 4.48% in January 2024 to 5.42% by December 2024. That’s a 21% increase while other social media platforms are hemorrhaging attention.

But here’s where it gets interesting.

Corporate brand pages saw an 8.3% decline in engagement during the first half of 2025, even as overall platform engagement was rising. Meanwhile, personal profiles from individual professionals are seeing record-high interaction rates.

The algorithm has made a clear choice: it wants human-to-human connection, not polished corporate broadcasting. When you post from your personal account sharing a genuine market observation, you’re statistically more likely to reach decision-makers than when your company’s marketing team posts a polished graphic.

Think about that for a second. The platform is actively pushing content from individuals over brands, which means your personal voice is now your company’s most powerful marketing channel.

For context: While X (formerly Twitter) saw engagement rates crater by 48%, and Facebook and Instagram continue their slow decline, LinkedIn maintained an average engagement rate of 3-3.5% for B2B content. Adobe’s data shows this makes it the strongest-performing platform for business content, period.

Content Format Performance: What Actually Gets Attention

Not all posts are created equal in 2025. The algorithm has clear favorites, and understanding this hierarchy is the difference between 2% engagement and 6%+ engagement.

Multi-Image Posts (Carousels): 6.60% average engagement


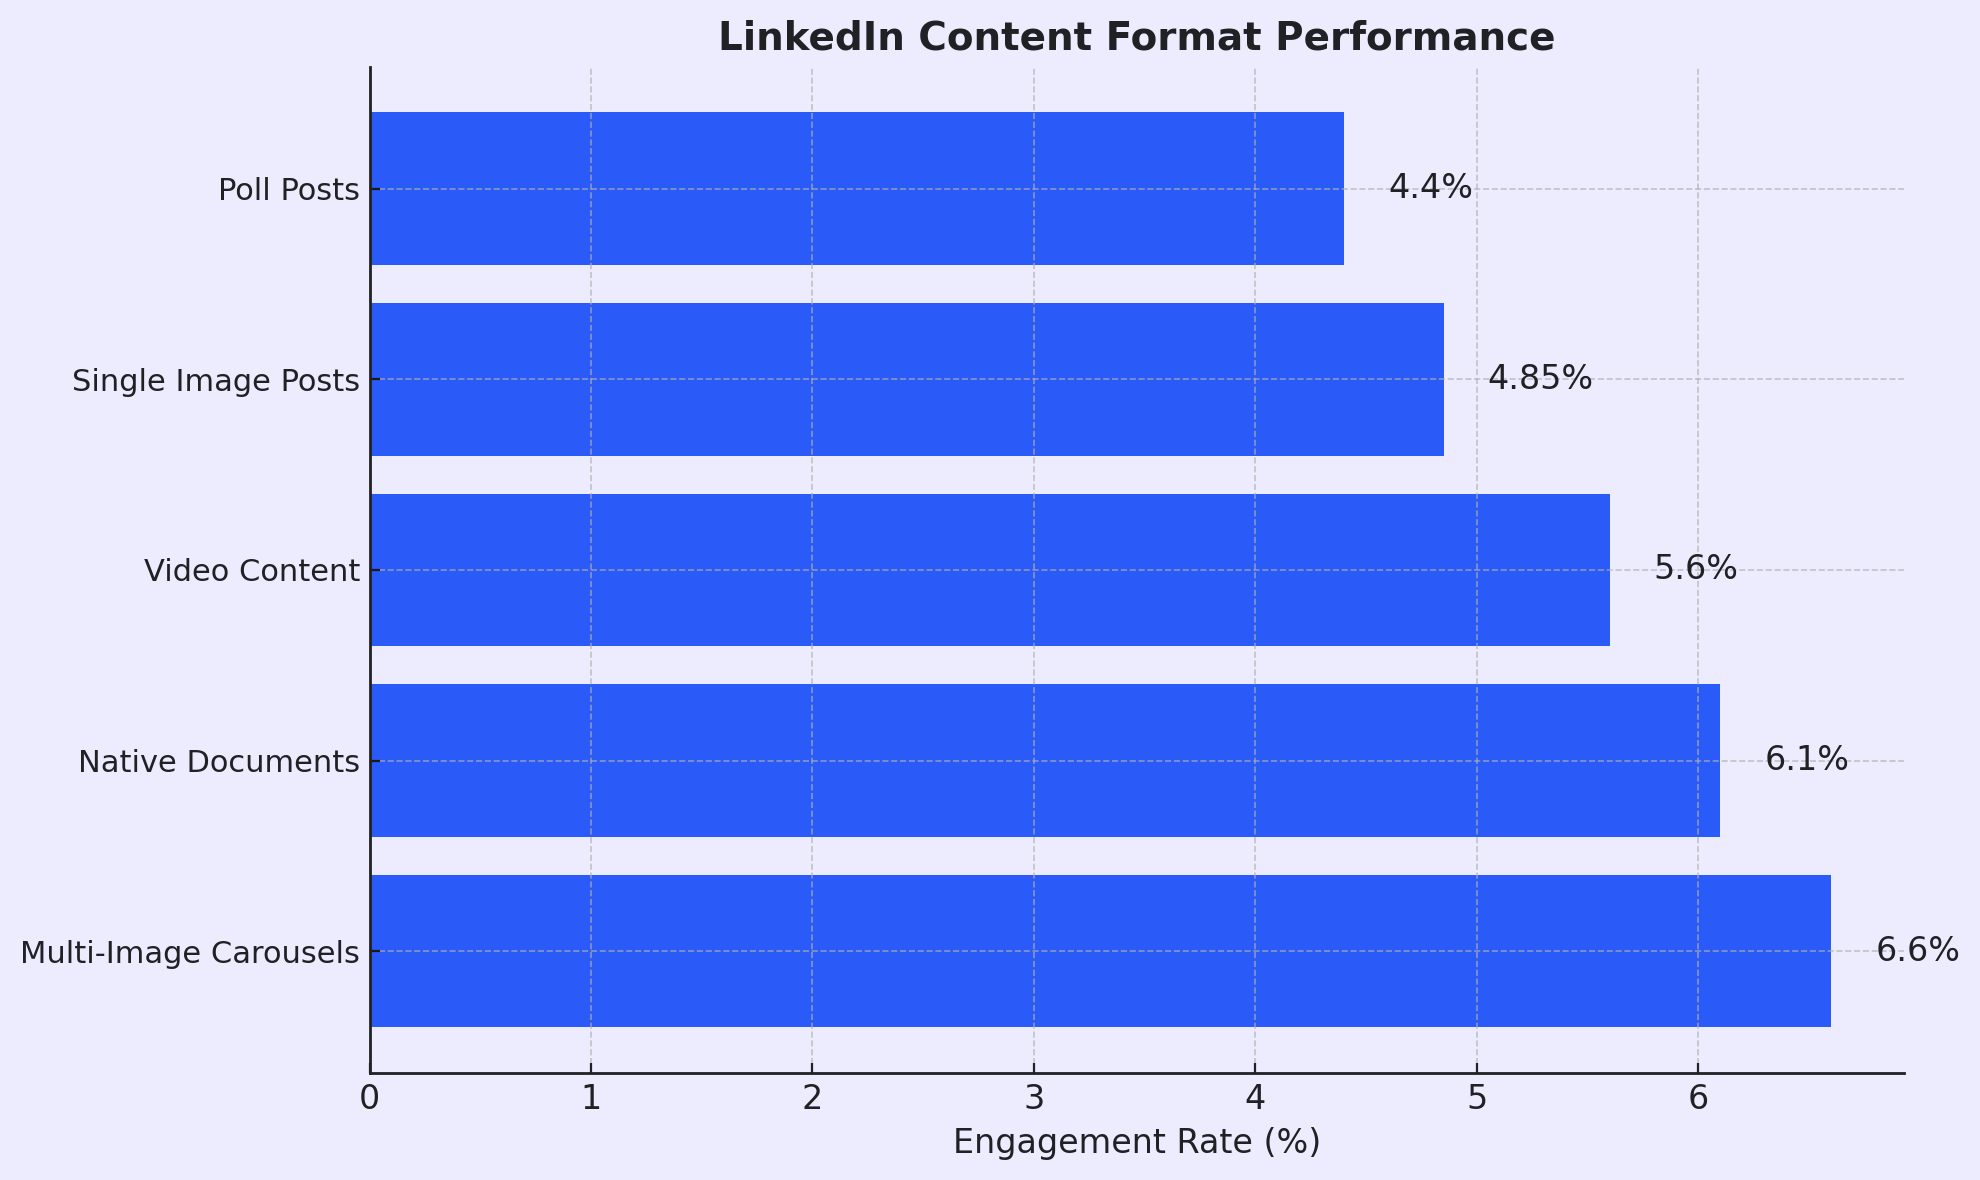
These are your highest performers. When someone has to swipe through multiple slides, it creates what LinkedIn calls “dwell time” — the seconds someone spends actively interacting with your content. The algorithm sees that swipe action and thinks: “This is valuable content that people are consuming deeply.”

Use carousels for frameworks, step-by-step guides, or any content that tells a story across multiple screens. Think “5 Cold Email Mistakes Killing Your Response Rate” with each mistake on its own slide.

Native Documents (PDFs): 6.10% average engagement

These are PDFs uploaded directly to LinkedIn that render as swipeable content in the feed. They perform nearly as well as carousels because they deliver the same dwell time benefits plus they get saved at higher rates than any other format.

The beauty here? You can take a one-page resource, break it into a 10-slide PDF, and suddenly it’s a high-engagement LinkedIn asset instead of a link people have to click away to see.

Video Content: 5.60% average engagement

Video has seen significant growth from previous years (up from around 4.00%). The auto-play feature in mobile feeds drives this metric. But there’s a catch: vertical video (4:5 or 9:16 aspect ratio) dramatically outperforms horizontal video because it occupies more screen real estate on mobile devices.

Keep videos between 30-90 seconds. Retention data shows a sharp drop-off after 90 seconds, but videos under 30 seconds have a 200% higher completion rate.

Single Image Posts: 4.85% average engagement

Still solid, but you’re leaving engagement on the table compared to carousels or documents. Use single images when you need visual interruption but don’t have content that naturally breaks into multiple slides.

Poll Posts: 4.40% average engagement

Polls have made a comeback, doubling their engagement from 2023. They offer the lowest friction for user interaction—literally one click to participate.

The secret strategy? The real value of polls isn’t the data, it’s the voter list. LinkedIn shows you exactly who voted and what they chose. That’s a pre-qualified list of engaged prospects for follow-up outreach.

Text-Only Posts: The Authenticity Play

Here’s where the data gets counterintuitive. Text-only posts often have lower rate percentages but can achieve higher absolute reach. Why? They feel spontaneous and authentic. They read like insights from a colleague, not content from a marketing department.

The algorithm knows this. Sprout Social’s research shows users are most likely to interact with text posts when engaging with business content. Use these for storytelling, vulnerability, and quick tactical insights. The key is formatting: short sentences, white space, and a killer first 3 lines before the “See More” truncation.

The External Link Penalty

One of the biggest algorithmic shifts in 2025: posts with external links get dramatically reduced reach. LinkedIn’s business model depends on keeping people on the platform viewing ads. When you try to drive traffic off-platform with a link, you’re fighting against the algorithm’s core objective.

The workaround? Deliver value entirely within the post. Reference external resources in the comments or your bio, but embrace a “zero-click” content strategy where the insights live natively on LinkedIn.

📊 Struggling with LinkedIn Engagement?

Here’s the Reality: LinkedIn engagement is just one piece of your outbound puzzle. Most successful teams aren’t choosing between LinkedIn and email—they’re using both strategically.

The Complete Approach: Master LinkedIn for relationship-building and credibility. Use verified email data for scalable, direct outreach. Combine both for 3x better conversion rates than either channel alone.

Book a Strategy Meeting to discover how successful teams are integrating LinkedIn visibility with email sequences for predictable pipeline generation.

Who’s Actually Seeing Your Content

Understanding LinkedIn’s audience quality explains why engagement rates matter more here than on other platforms:

33% of LinkedIn members hold a bachelor’s degree, and another 18% hold a master’s degree. This concentration of educated professionals correlates directly with decision-making power and corporate seniority.

More importantly: 4 out of 5 LinkedIn members drive business decisions within their organizations. This is the stat that changes everything. When your post gets 1,000 views on LinkedIn, those views statistically include budget holders, influencers, and executives. Compare that to 1,000 views on Instagram or TikTok—the business impact is incomparable.

 📊 Views Don’t Pay Bills

The smartest LinkedIn users combine content visibility with direct outreach to decision-makers

Geographic concentration matters too: The platform skews toward suburban (39%) and urban (32%) dwellers, aligning perfectly with major economic hubs where enterprise business happens.

This demographic reality is why LinkedIn statistics favor depth over virality. The algorithm knows its users are sophisticated professionals who value substance, which is why documents and carousels (depth-focused formats) outperform flashy visual content.

The Algorithm’s Hidden Rules

Knowing engagement rates is useful. Understanding why the algorithm assigns those rates is powerful.

LinkedIn’s feed algorithm in 2025 is a predictive engine designed to maximize two variables: user retention and meaningful social interaction. It underwent significant tuning in late 2024 to combat “engagement bait” and prioritize genuine expertise.

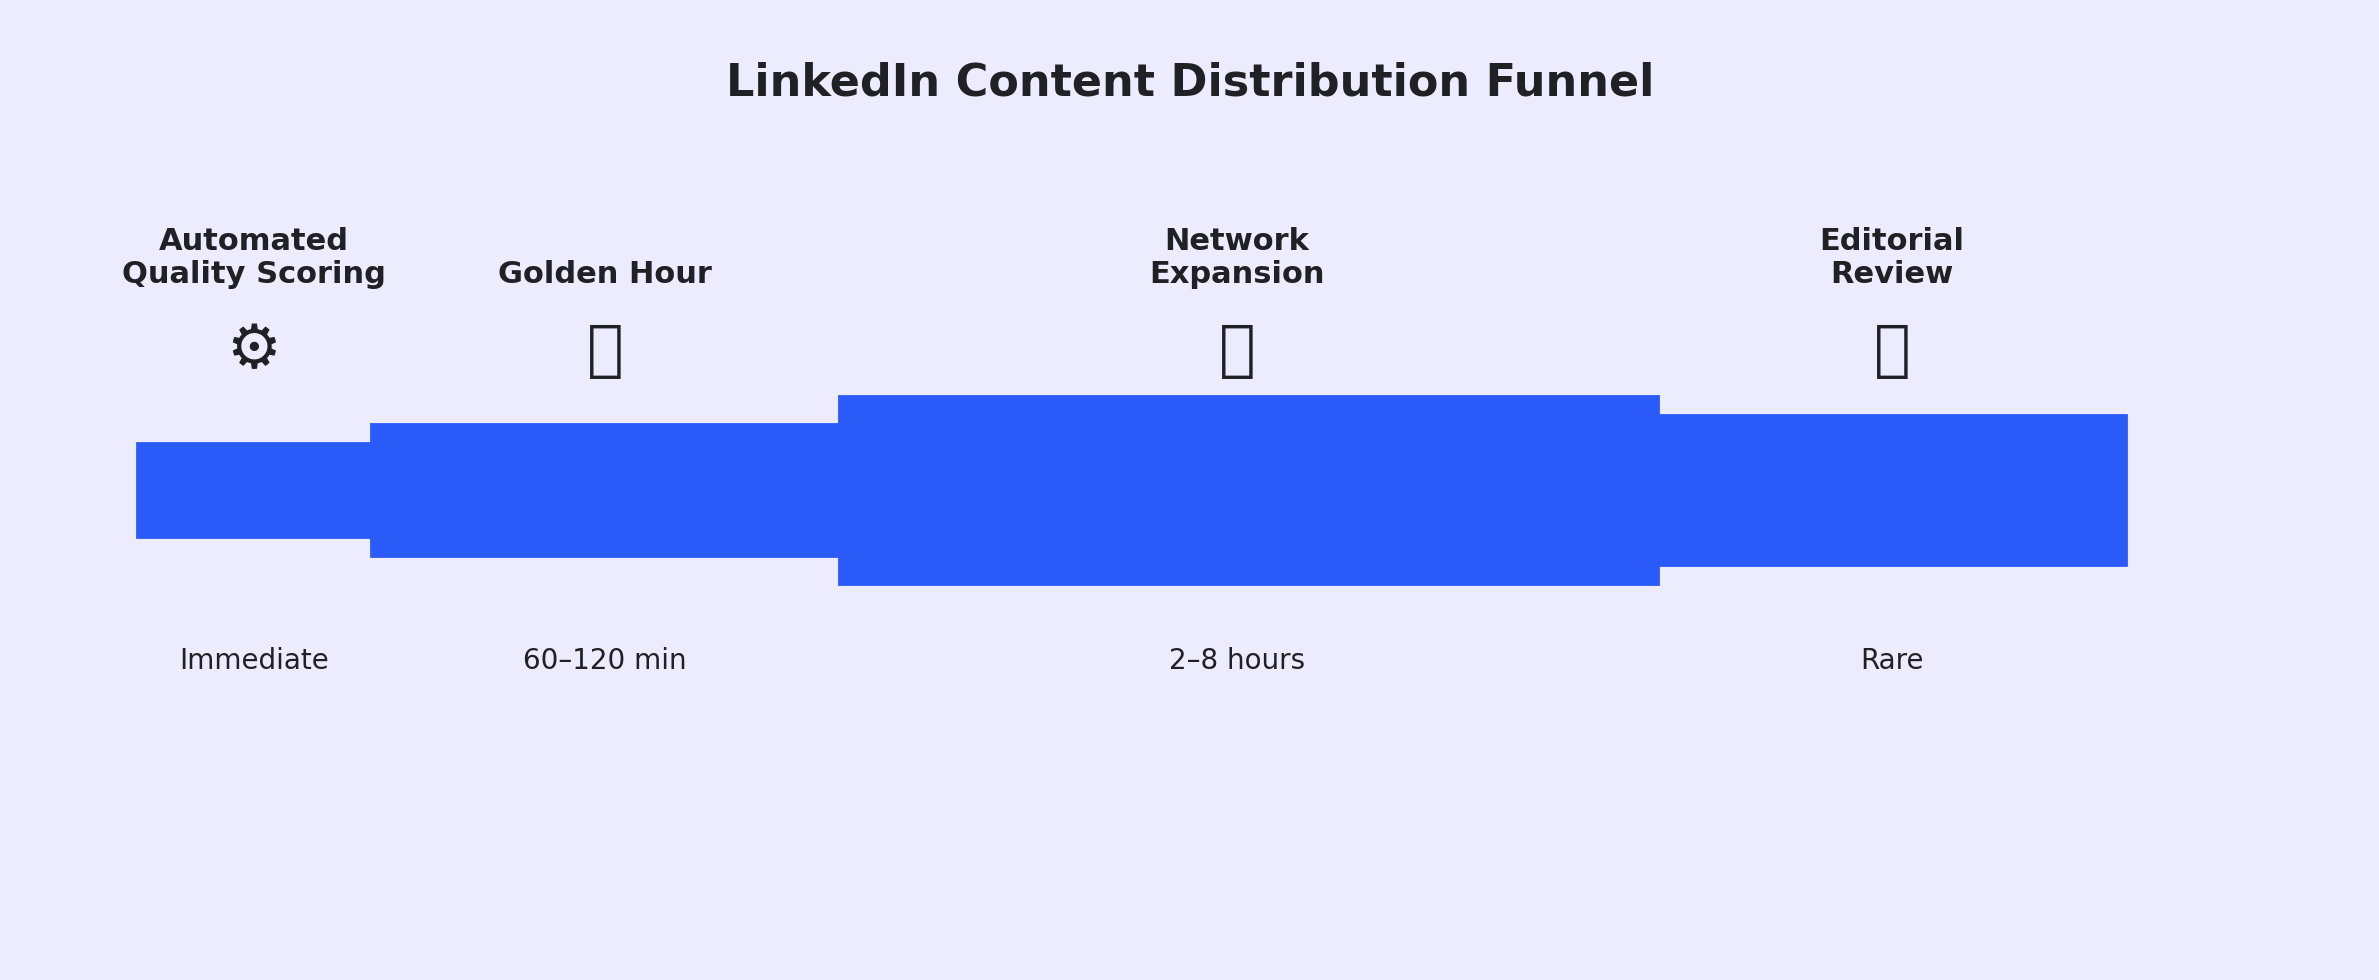
The Four-Stage Distribution Filter

Every post you publish goes through a rigorous four-stage filtering process. Understanding this lets you reverse-engineer success.

Stage 1: Automated Quality Scoring (Immediate)

The instant you hit “Post,” AI analyzes your content for spam signals, prohibited content, and low-quality indicators like excessive hashtags or broken grammar. Posts flagged as “spam” are suppressed immediately. Posts marked “low quality” get minimal distribution. Only “clear” posts move forward.

One warning: AI-generated generic text can trigger low-quality flags if it lacks human-like nuance or distinctive voice. Use AI for ideation, not copy-paste posting.

Stage 2: The “Golden Hour” (First 60-120 Minutes)

This is your make-or-break window. Your post gets shown to a small sample of your network—typically your most active connections and recent interactors. The algorithm monitors this cohort for engagement velocity.

If they scroll past without stopping? Your post effectively dies.

If they engage—like, comment, share, or simply stop to read—your post accumulates a “velocity score” that determines whether it expands to broader audiences.

This is why timing matters so much. You need to post when this specific initial cohort is actively checking LinkedIn, not when they’re in back-to-back meetings or asleep.

Stage 3: Network Expansion (Hours 2-8)

If your velocity score exceeds the threshold, the algorithm expands visibility to your broader network and second-degree connections (connections of connections). This is where virality begins.

At this stage, the algorithm prioritizes “conversation depth.” A post with 10 comments that have replies is weighted higher than a post with 50 likes but no comments. The system interprets dialogue as a signal of high-value content worth amplifying.

Stage 4: Editorial Review (Rare)

For exceptionally high-performing content, human editors may review it for inclusion in LinkedIn News or trending topic feeds. This provides massive platform-wide reach but is rare for standard business content.

The Supremacy of “Dwell Time”

The 2025 algorithm update solidified dwell time as the primary ranking signal. This metric measures how long a user spends with your content on their screen.


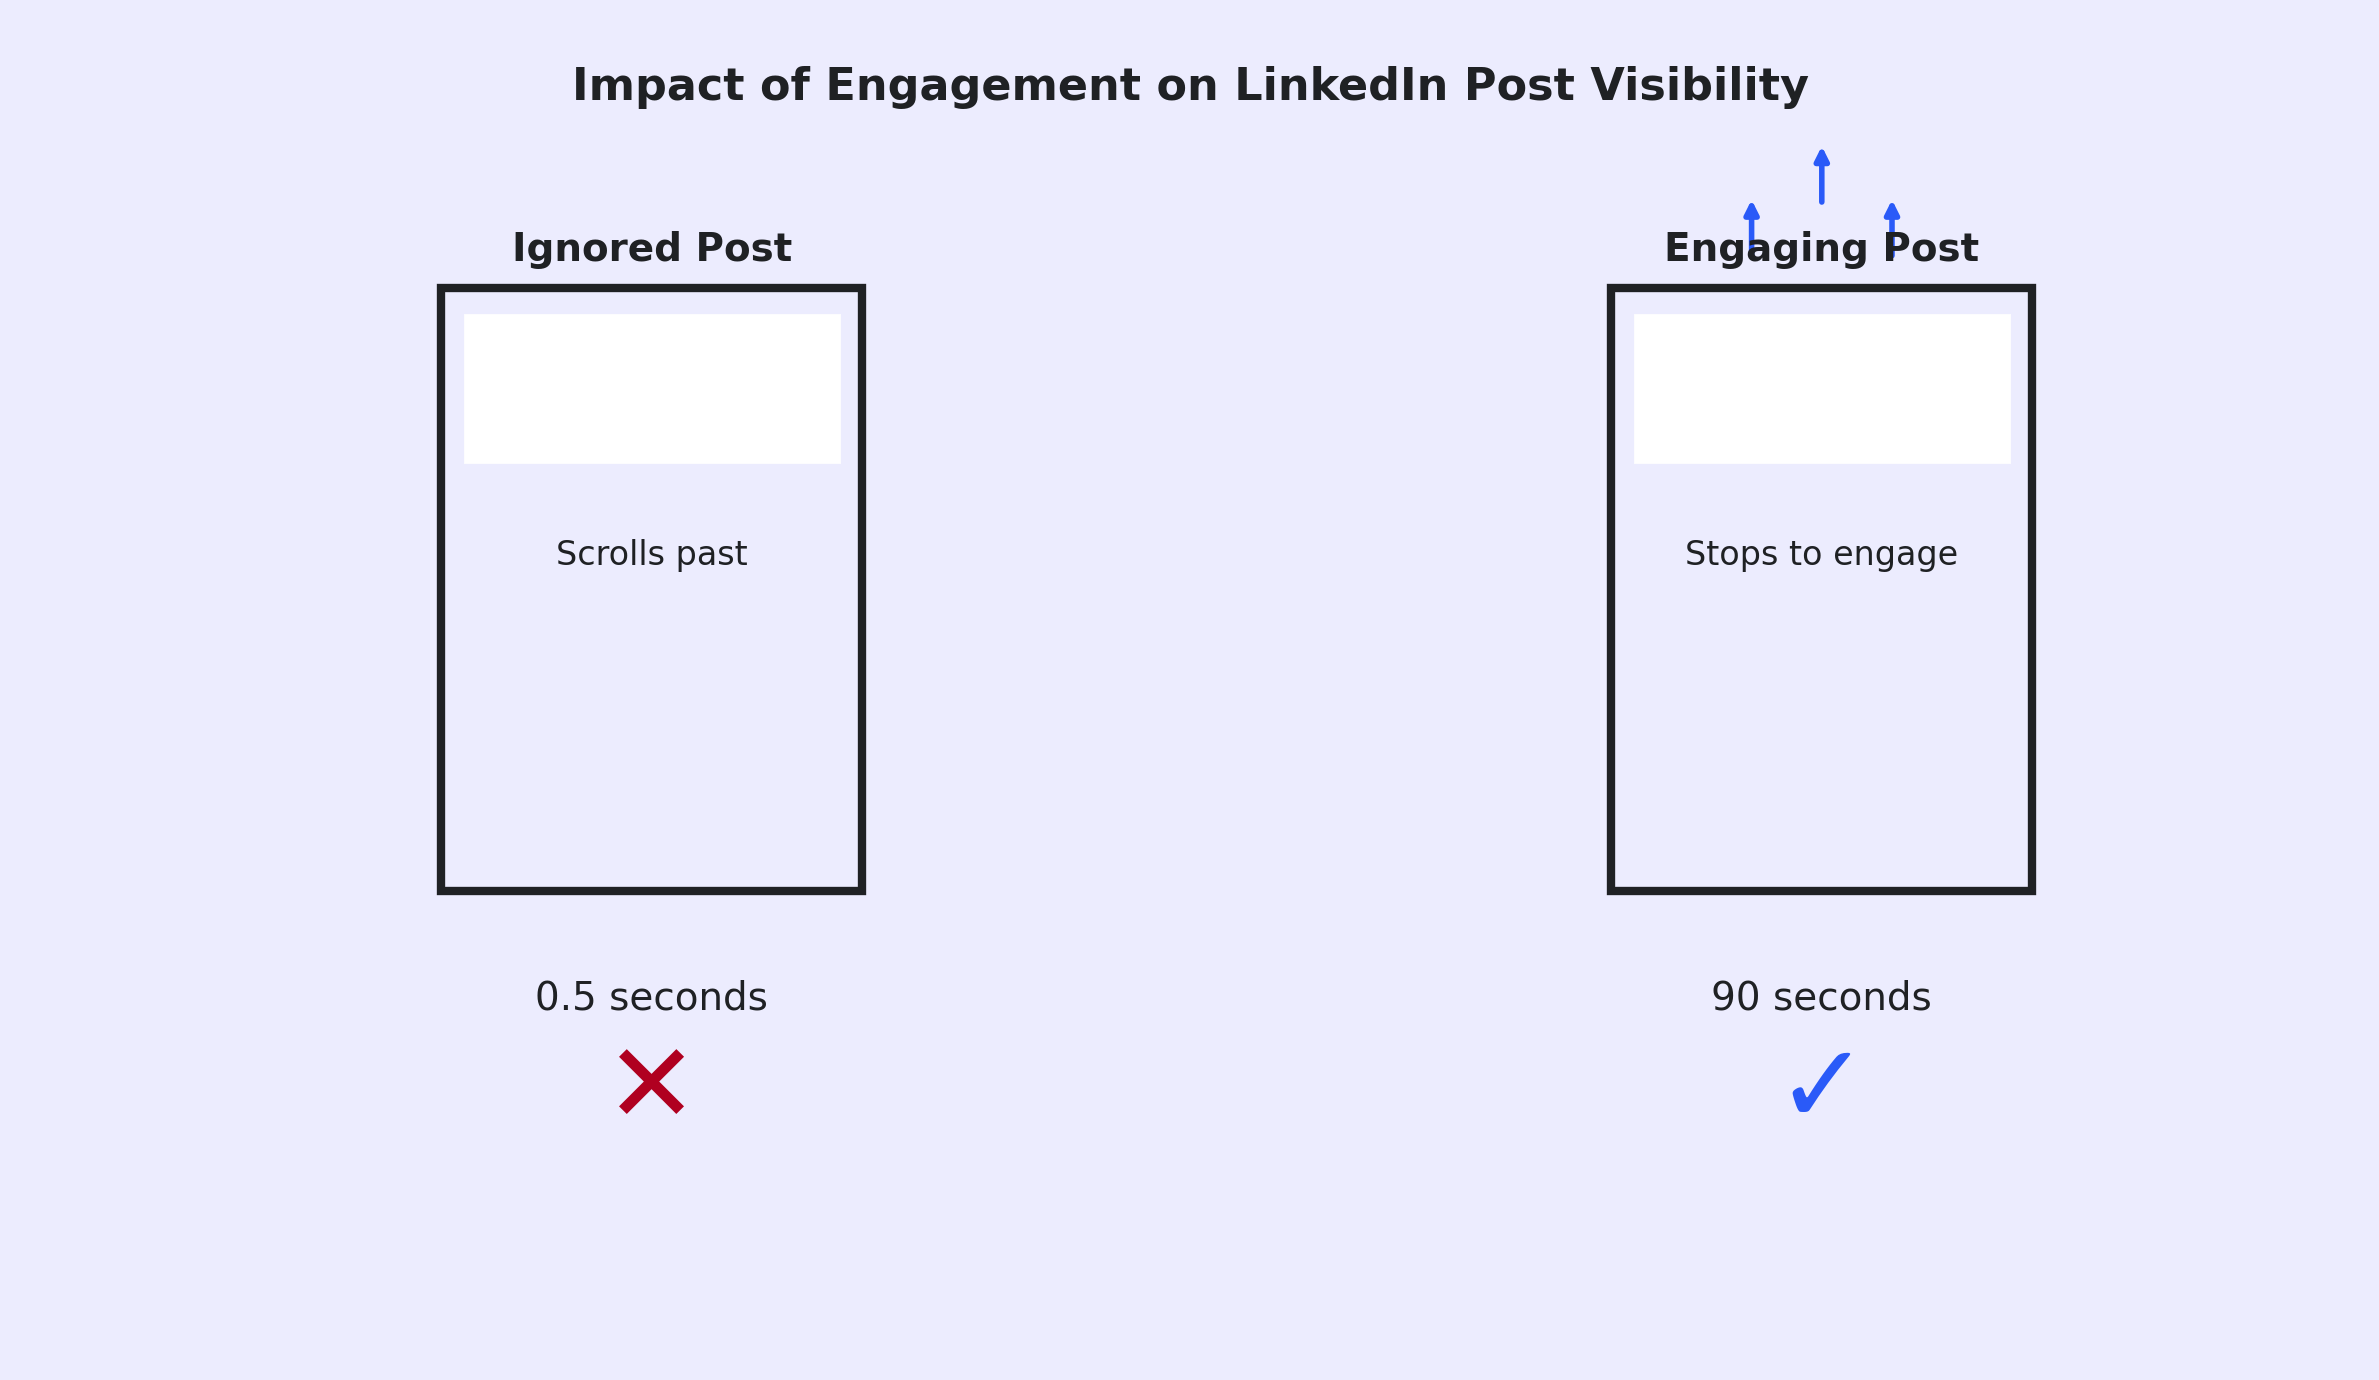
A user scrolling past in 0.5 seconds sends a negative signal. A user stopping to read a long text post for 45 seconds, or swiping through a 10-slide carousel for 90 seconds, sends a massive positive signal.

This explains the statistical performance gap between formats. Carousels and long-form text mechanically force users to spend time with your content. A captivating 30-second video that hooks viewers instantly will outperform a static image simply because the user stays on the feed longer.

The shift from clicks to dwell: Historically, clicks were gold standard metrics. Now LinkedIn prefers consumption to happen in situ (on the platform). They want users reading your text post natively, not clicking away to your blog.

Not All Engagement Counts Equally

The algorithm creates a weighted score for different interactions:

  • Share with Comment: Highest value
  • Comment (longer than 5 words): High value
  • Like/Reaction: Low value (vanity metric)
  • Click “See More”: Medium value (dwell indicator)

Here’s a power tip: Responding to comments within the first hour can boost your post’s visibility by up to 35%. This “comment velocity” signals to the algorithm that a live conversation is happening, prompting it to show the post to more people to keep the dialogue going.

Don’t just post and ghost. Stay engaged with your audience in those critical first 60 minutes.

⏰ The Golden Hour Advantage

 While you’re optimizing post timing, successful teams are booking meetings through strategic outreach

🎯 LinkedIn Visibility is Great. Meetings Are Better.

The Hard Truth: LinkedIn engagement feels good, but it doesn’t pay the bills. Meetings do. Closed deals do.

What Top Performers Do: They use LinkedIn to build credibility and start conversations. Then they use targeted email outreach to book actual meetings with qualified prospects who already recognize their name.

The Difference: LinkedIn gets you noticed. Email gets you on calendars. Together, they create a predictable revenue engine.

Discover how to build a complete outbound strategy (not just social media) that actually fills your pipeline.

Best Times to Post on LinkedIn

Timing isn’t everything, but it’s worth an easy 30-50% boost in initial engagement if you get it right.

The data converges on specific high-engagement windows based on B2B work patterns:

Tuesday: 8:00 AM – 2:00 PM

This is peak B2B week. Sustained, high-quality engagement throughout this window. Professionals are in work mode, checking LinkedIn during breaks between meetings and tasks.

Wednesday: 8:00 AM – 12:00 PM

Often cited as the single best day for engagement. Similar to Tuesday but with slightly higher concentration in morning hours. Post by 10:00 AM for maximum exposure.

Thursday: 9:00 AM – 2:00 PM

Strong engagement, but it starts tapering significantly after 2:00 PM as people shift into weekend preparation mode.

Monday: 11:00 AM – 1:00 PM

Mornings are terrible (meetings, email catch-up). Lunchtime is your first viable window. Don’t post before 10:00 AM on Mondays.

Friday: 7:00 AM – 11:00 AM

Early wins are possible, but engagement drops off sharply after lunch as professionals mentally transition to weekend mode. If you’re posting Friday, do it before 10:00 AM.

⚡ Stop Chasing Perfect Timing

LinkedIn’s best feature isn’t the algorithm—it’s direct access to 65 million decision-makers

The “Lunch Break” Sweet Spot

Data shows a distinct spike in LinkedIn usage between 11:00 AM and 1:00 PM across all time zones. Professionals check the platform while eating or taking mental breaks.

Pro move: Post at 10:45 AM. Your content hits the top of the feed right as the lunch scroll begins.

The Weekend Opportunity

While corporate pages see near-zero engagement on weekends, personal profiles can see surprisingly high engagement on Saturday mornings (9:00 AM – 11:00 AM).

Why? C-level executives and founders—often your target audience—use this quiet time to consume thought leadership without weekday distractions. Posting high-level strategic content on Saturday morning can be a “blue ocean” strategy with significantly less feed competition.

LinkedIn Post Analytics: Accessing Your Data

Understanding these statistics only helps if you can track your own performance.

Finding Your Post Analytics

For individual posts:

  1. Navigate to your post
  2. Click the analytics icon (bar chart) below your post
  3. Review impressions, engagement rate, clicks, and audience demographics

For profile-level insights:

  1. Go to your LinkedIn profile
  2. Click “Analytics” in the left sidebar (desktop) or under your profile picture (mobile)
  3. View trends across all your content: post views, search appearances, and profile views

The LinkedIn API Limitations

LinkedIn’s API is notoriously restrictive compared to platforms like X or Facebook. The Marketing API allows retrieval of company page analytics (impressions, clicks, follower demographics), but the Member Protocol for personal post performance is tiered and often restricted to official partners.

Critical limitation: The standard LinkedIn API does not provide a list of specific identities who viewed your posts. It provides aggregate data (e.g., “50 people from the Software Industry viewed this”). Third-party tools claiming to show exactly who viewed your post often use non-compliant scraping techniques that risk account restrictions.

Finding Your Saved Posts

LinkedIn updated the UI location for saved content, causing confusion:

On Desktop:

  1. Go to your Home Feed
  2. Look at the left sidebar under your profile summary
  3. Click “My Items”
  4. Select the “Saved Posts” tab

On Mobile:

  1. Tap your profile picture in the top-left corner
  2. In the slide-out menu, tap “My Items” (sometimes nested under “Resources”)
  3. Select “Saved Posts”

Pro tip: Use the Collections feature to organize saved posts into folders (“Cold Outreach Ideas,” “Competitor Analysis,” “Content Inspiration”). Due to lack of native search functionality, power users often export saved posts to tools like Notion for better organization and retrieval.

💡 The Missing Piece in Your Outbound Strategy

Everyone knows: Post consistently on LinkedIn. Build your personal brand. Share valuable insights.

What they don’t tell you: That only fills the top of your funnel. You still need a scalable way to move those engaged prospects into actual sales conversations.

The Integration Strategy: Use LinkedIn for visibility and credibility. Build your email list with verified contacts. Run personalized email sequences to the people who are already engaging with your content.

This is how modern B2B teams hit quota consistently—not by choosing between channels, but by orchestrating them together.

Learn the complete framework for turning LinkedIn engagement into booked meetings.

Book Strategy Meeting →

</div>

How LinkedIn Statistics Compare to Email Outreach

Here’s where context matters for your overall strategy.

LinkedIn is phenomenal for relationship-building and thought leadership. But it’s not the complete picture. Let’s compare:

Metric

Cold Email

LinkedIn Social Selling

Response Rate

1-5%

10-15% (personalized InMail/DM)

Lead Generation

Baseline

277% more effective than other social platforms

Scalability

High (automated sequences)

Low (manual/connection limits)

Cost

Low (cost per thousand)

High (time/labor intensive)

Trust Barrier

High (spam filters)

Low (identity verified)

The “Warm-Up” Effect

Here’s the strategic integration: Prospects who engage with your LinkedIn content are 67% more likely to respond to a follow-up email.

This is the “warm-up” effect in action. Instead of sending a cold email immediately, you engage with a prospect’s LinkedIn posts (likes, thoughtful comments) for 3-5 days. This puts your name and face in their notification feed repeatedly.

When your email eventually lands in their inbox, they recognize your name. That familiarity bypasses their psychological “spam” filter. They think: “I’ve seen this person before. They seem to know what they’re talking about.”

This isn’t theory. Sales teams running this integrated approach—LinkedIn engagement followed by targeted email—see conversion rates 3x higher than teams using either channel in isolation.

Leveraging Sales Intelligence Tools

The synergy between LinkedIn data and sales intelligence platforms is the engine of modern prospecting.

Tools like Apollo.io and ZoomInfo let you view a LinkedIn profile and instantly retrieve verified email addresses and phone numbers via browser extension. This bridges the gap between LinkedIn (where you find and research prospects) and email (where you execute scalable outreach).

Trigger-based prospecting takes this further. When a prospect likes your post about “Email Deliverability,” you can scrape that list of likers, enrich it with contact data from Apollo or ZoomInfo, and send a highly targeted email referencing the specific post they engaged with.

This approach leverages public LinkedIn behavior to inform private email outreach—dramatically increasing relevance and response rates.

🎯 Ready for Real Results?

Stop guessing with algorithms. Start conversations with the exact decision-makers you need to reach.

7-day Free Trial |No Credit Card Needed.

Conclusion

LinkedIn in 2025 is no longer about vanity metrics or sporadic posting. It’s about understanding the algorithmic mechanics that determine visibility and structuring your content strategy accordingly.

The key takeaways:

Multi-image posts and native documents deliver the highest engagement because they maximize dwell time. Video is surging but must be optimized for vertical mobile viewing. Text posts remain powerful for authenticity when formatted correctly.

Timing matters tremendously—Tuesday through Thursday mornings are your prime windows, with a specific sweet spot at 10:45 AM before the lunch scroll.

Personal profiles are crushing corporate pages because the algorithm prioritizes human-to-human connection over broadcast marketing.

But here’s the reality: LinkedIn engagement is just the beginning of your sales process, not the end. The most effective approach combines LinkedIn visibility with targeted email outreach, using each channel for what it does best.

LinkedIn builds credibility and familiarity. Email drives meetings and pipeline. Together, they create a complete outbound engine that actually moves revenue.

FAQs

What is the best content format for LinkedIn engagement in 2026?

Multi-image carousel posts lead with 6.60% average engagement, followed closely by native documents (PDFs) at 6.10%. These formats force users to interact by swiping, which increases dwell time—the algorithm's primary ranking signal. Video content comes in third at 5.60%, but only if optimized for vertical mobile viewing (4:5 or 9:16 aspect ratio).

When should I post on LinkedIn for maximum reach?

Tuesday and Wednesday between 8:00 AM and 2:00 PM show the highest engagement rates. The optimal micro-window is 10:45 AM—just before the lunch break when professionals start checking social media platforms. Avoid Monday mornings before 11:00 AM and Friday afternoons after 2:00 PM, when engagement drops significantly.

What is dwell time and why does it matter?

Dwell time measures how long users spend viewing your content on their screen. It's the primary algorithm ranking signal in 2025. If users scroll past your post in 0.5 seconds, it signals low quality. If they stop to read for 45 seconds or swipe through a carousel for 90 seconds, it signals high value, prompting the algorithm to show your content to more people.

Do personal profiles really outperform company pages?

Yes, dramatically. While overall LinkedIn engagement rates rose from 4.48% to 5.42% throughout 2024, corporate brand pages saw an 8.3% decline in engagement during the first half of 2025. The algorithm actively prioritizes content from individual professionals over branded corporate content because it interprets person-to-person sharing as more authentic and valuable.

How do I find my saved posts on LinkedIn?

On desktop: Go to your Home Feed, look for "My Items" in the left sidebar under your profile stats, then click "Saved Posts." On mobile: Tap your profile picture in the top-left, tap "My Items" in the menu (sometimes under "Resources"), then select "Saved Posts." Use the Collections feature to organize saved content into folders for easier retrieval.

How to Build a High-Converting B2B Sales Funnel from Scratch on LinkedIn

How to Build a High-Converting B2B Sales Funnel from Scratch on LinkedIn ​