LinkedIn ProFinder Statistics: Complete Data on the Services Marketplace
- Sophie Ricci
- Views : 28,543
Table of Contents
LinkedIn ProFinder Statistics
- 10 million freelancers and small business owners active on Services Marketplace – massive growth from 50,000 in 2016 beta, now one of largest professional services platforms
- 48% year-over-year growth in 2024 – significantly outpaces LinkedIn’s general user growth, professionals shifting profiles from passive resumes to transactional storefronts
- 8 service requests per minute flowing through platform – constant stream of demand but creates intense competition among millions of providers
- 50,000 freelancers in 2016 during beta/initial rollout – exclusive gated community with strict vetting before opening gates in 2021
- Nearly 50% of providers in three categories: business coaches, marketers, and designers – heavy concentration making differentiation critical
- Consulting dominates with 1,031,459 providers – most crowded category requiring niche specialization to stand out from competition
- Marketing: 685,670 providers, Operations: 566,670, Design: 517,847 – showing massive provider density across major service categories
- 65 million business decision-makers on LinkedIn – C-Suite executives, VPs, Directors with actual budget authority accessible on platform
- 4 out of 5 LinkedIn members drive business decisions – not just check-writers but stakeholders who influence purchasing in complex B2B sales
- 80% of B2B social media leads come from LinkedIn – Twitter/X generates just 13%, Facebook only 7%, showing platform dominance
- LinkedIn InMail: 18-25% response rates vs traditional cold email: 3% or less – 6-8x better performance for direct outreach
- LinkedIn Lead Gen Forms: 13% conversion vs standard B2B landing pages: 2.35% – 5.5x performance differential showing quality of LinkedIn traffic
- Cost Per Lead 28% lower than Google AdWords – higher CPC ($5-$15) but fewer wasted clicks on irrelevant users
- 65% year-over-year increase in service requests – demand growing faster than supply, creating opportunity despite provider saturation
- 73% of hiring managers plan to maintain or increase freelancer reliance – macro shift as US hiring sits 20% below pre-pandemic with companies freezing FTE budgets
Remember when finding quality freelancers meant sorting through endless Upwork proposals? LinkedIn changed that game completely.
LinkedIn ProFinder launched in 2015 as a curated marketplace connecting businesses with verified professionals. Fast forward to 2024, and it’s evolved into something much bigger—the Services Marketplace. With 10 million freelancers now on the platform and service requests flooding in at 8 per minute, the numbers tell a compelling story about where professional services are headed.
If you’re weighing whether to list your services or hire through LinkedIn, the data below will give you the complete picture. From provider density to response rates, we’re breaking down every statistic that matters.
🎯 Stop Waiting for Inbound Leads
Reach 65M+ decision-makers directly with LinkedIn outbound that delivers 15-25% response rates
LinkedIn ProFinder Statistics: The Evolution from ProFinder to Services Marketplace
Â

Â
The platform you might still search for as “ProFinder” officially transitioned to the Services Marketplace in 2021. Here’s what changed and what the numbers reveal.
The Legacy ProFinder Era (2015-2021)
When ProFinder launched, it operated as a gated community. You couldn’t just sign up—LinkedIn vetted every applicant. By 2016, roughly 50,000 freelancers had been accepted during the beta and initial rollout.
The acceptance process was strict. Professionals with 20+ years of experience were sometimes rejected if they lacked on-platform recommendations. This “quality over quantity” approach kept the marketplace exclusive but limited.
The service breakdown was concentrated:
- Nearly 50% of providers fell into three categories: business coaches, marketers, and designers
- 40% of U.S. freelancers clustered in just four states: California, Texas, Florida, and New York
ProFinder used a Request for Proposal model. Businesses posted needs, and LinkedIn distributed leads to qualified local professionals. Freelancers got 10 free proposals, then needed to upgrade to Business Plus at around $60 per month.
Â

Â
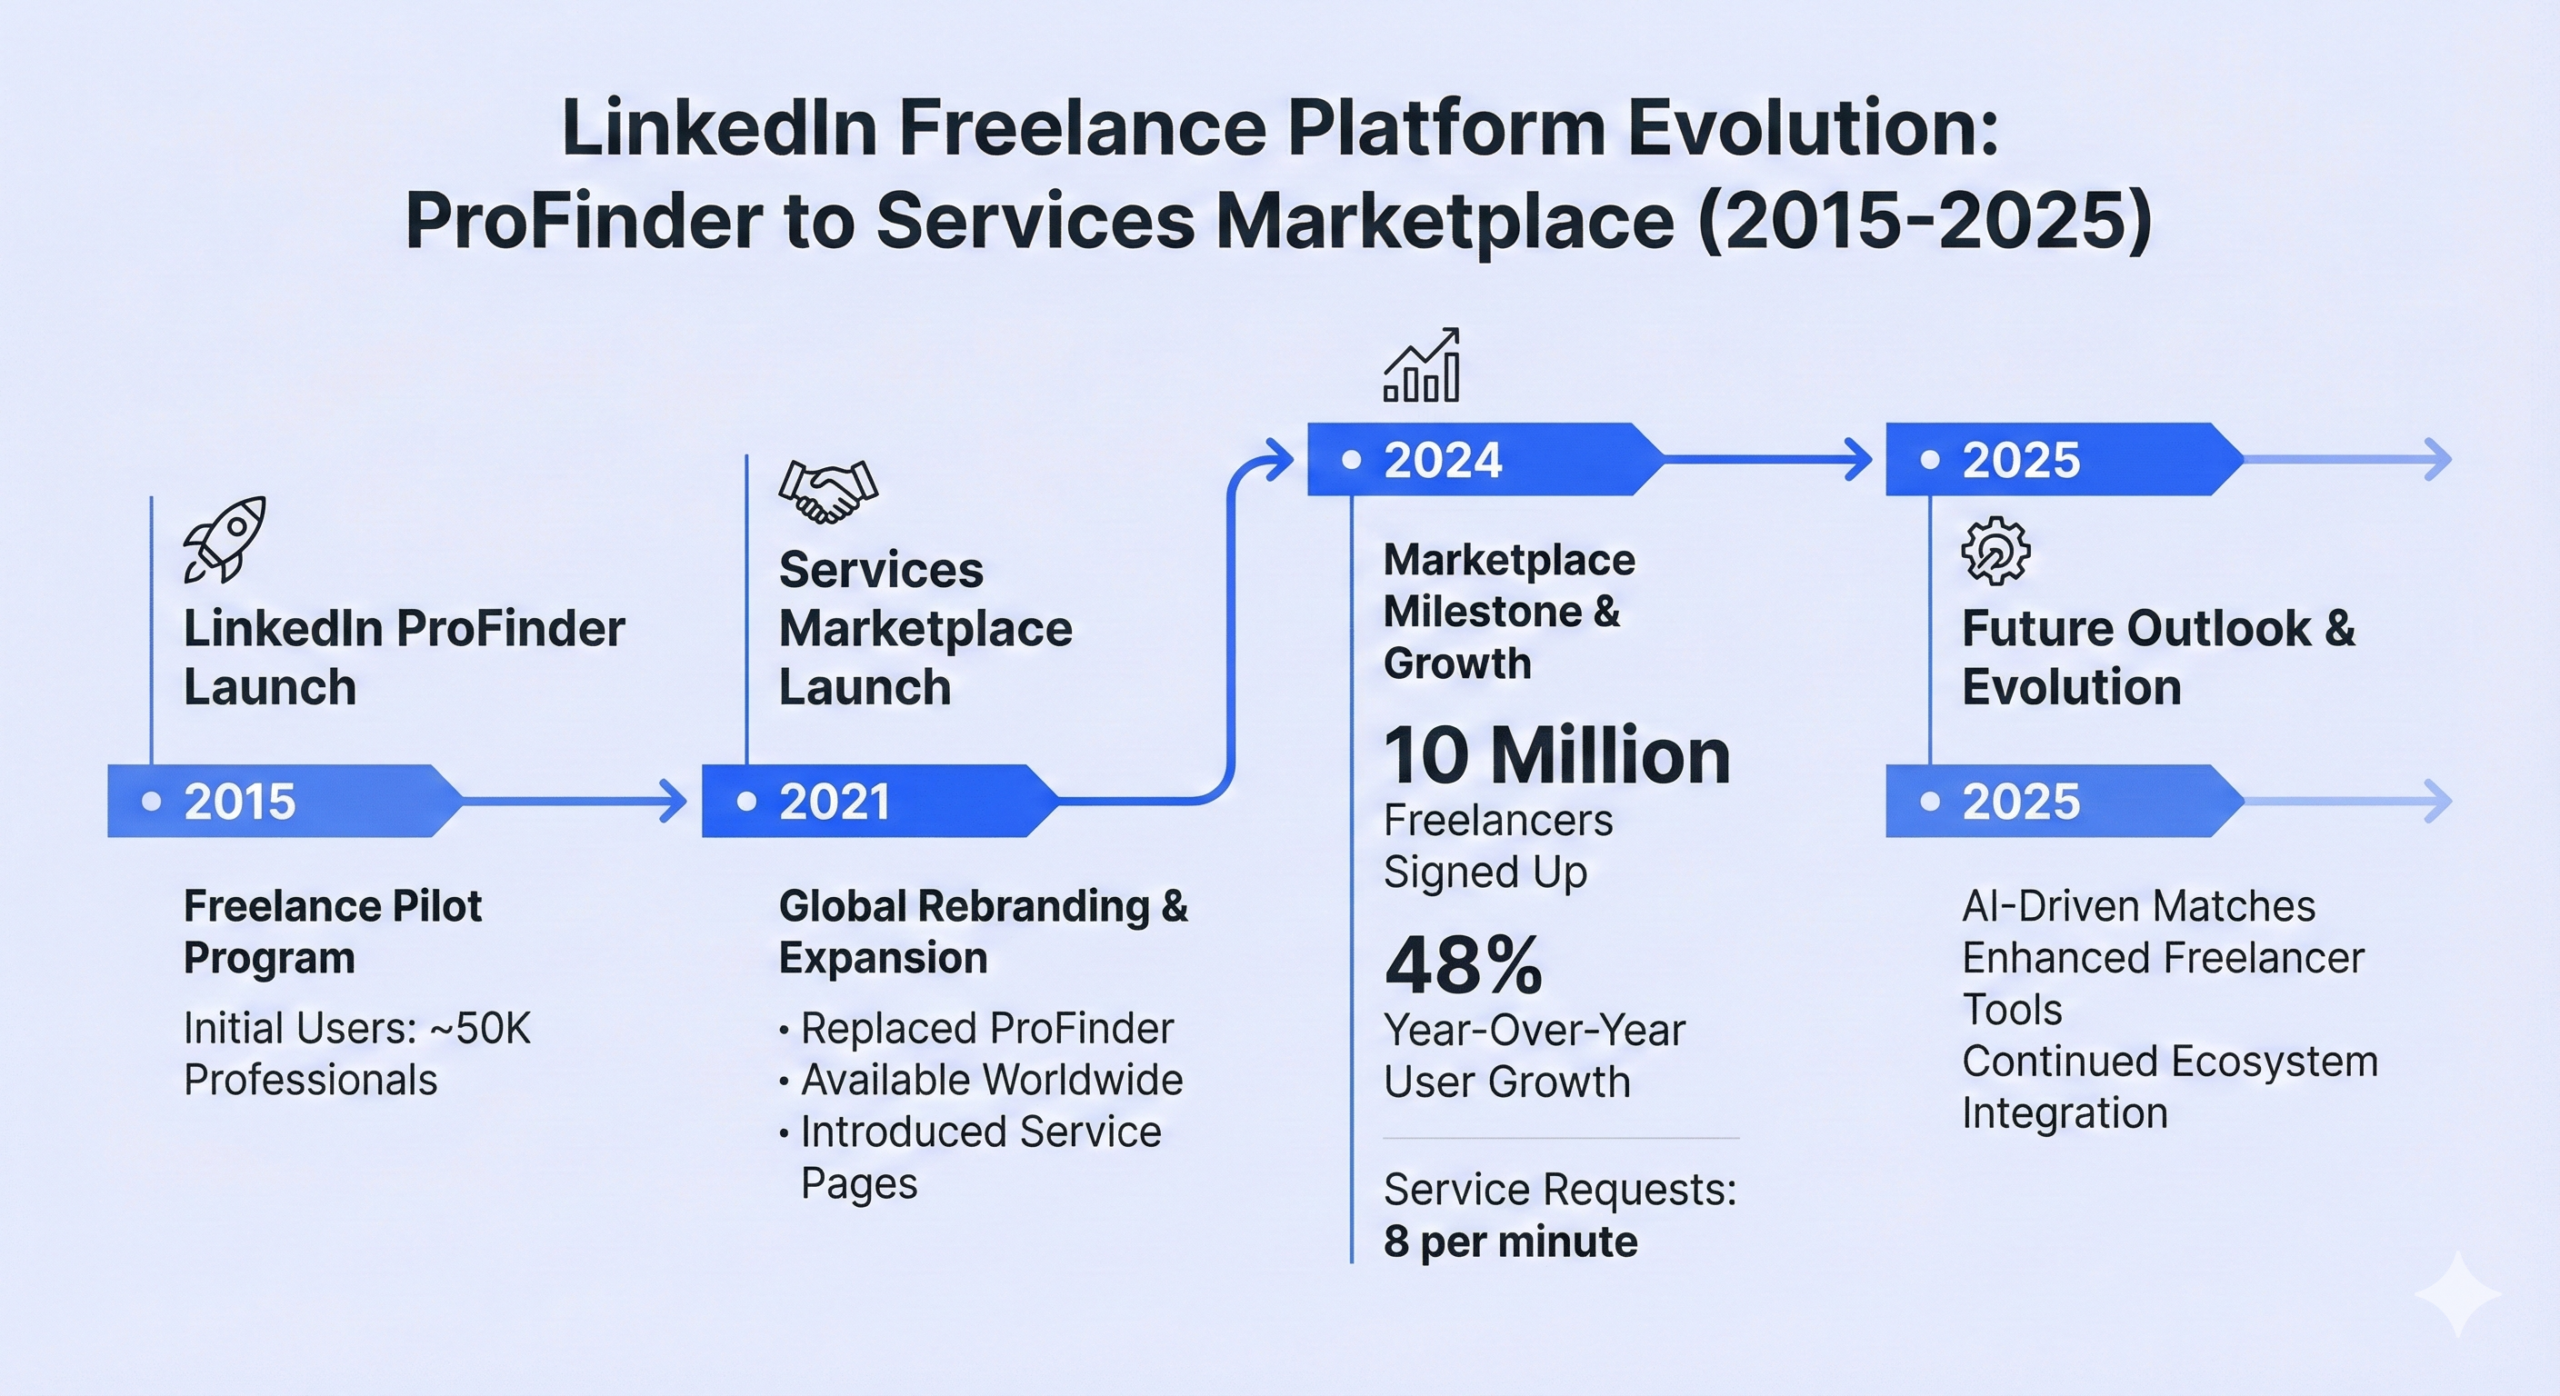
Services Marketplace Growth Explosion (2021-Present)
When LinkedIn opened the gates in 2021, growth went exponential.
Platform Scale:
- 10 million freelancers and small business owners now active on the Services Marketplace
- 48% year-over-year growth in 2024 alone
- 8 service requests per minute flowing through the platform
This isn’t just growth—it’s acceleration. The 48% YoY increase significantly outpaces LinkedIn’s general user growth, meaning professionals are actively shifting their profiles from passive resumes to transactional storefronts.
âš¡ Tired of Marketplace Competition?
While 10M providers fight for 8 requests/min, our LinkedIn outbound puts you directly in front of decision-makers
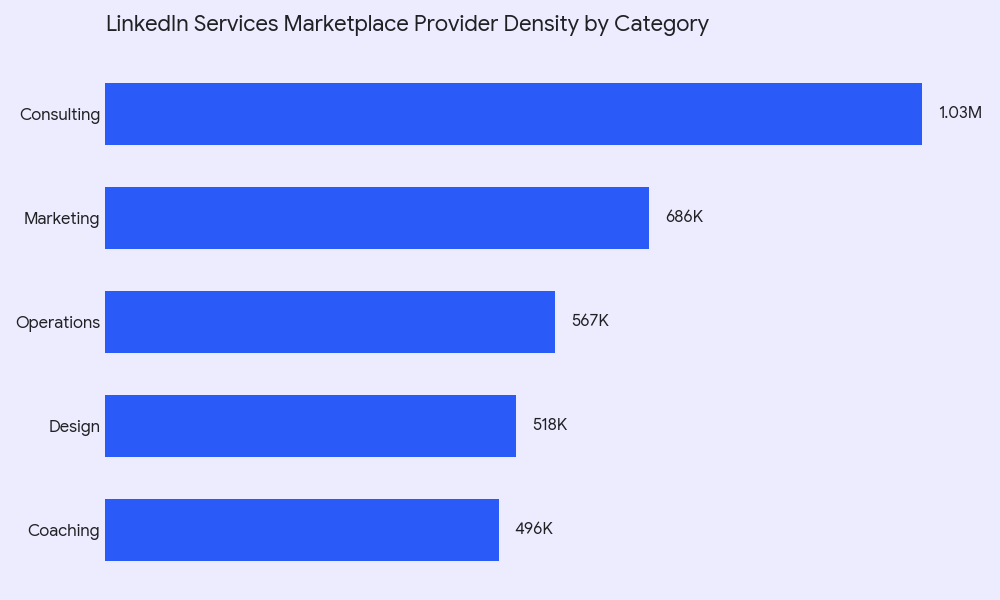
Provider Density by Category
Here’s where those 10 million providers are concentrated:
Service Category | Provider Count |
Consulting | 1,031,459 |
Marketing | 685,670 |
Operations | 566,670 |
Design | 517,847 |
Coaching & Mentoring | 495,678 |
Software Development | 348,945 |
Writing | 333,278 |
Finance | 205,684 |
IT Services | 183,351 |
Accounting | 174,545 |
Consulting dominates with over 1 million providers. If you’re in this category, you’re competing with a massive crowd. Marketing follows with 685,670 providers, while more specialized services like Finance and Accounting have significantly less competition.
The takeaway? Niche specialization matters more than ever. “Business Consultant” gets lost in the noise. “SaaS Pricing Consultant for B2B” cuts through it.
Â

Â
The Quality Gap
With 10 million profiles, visibility depends on optimization. The data reveals most providers are missing key elements:
- Many profiles remain incomplete or outdated
- Basic requirement: At least 50 connections to appear complete
- Critical hook: The first 220-270 characters of your About section appear before the “see more” fold (mobile shows only ~100 characters)
Profiles that fail to articulate value in that narrow window suffer high bounce rates. This creates opportunity for professionals who invest in proper optimization.
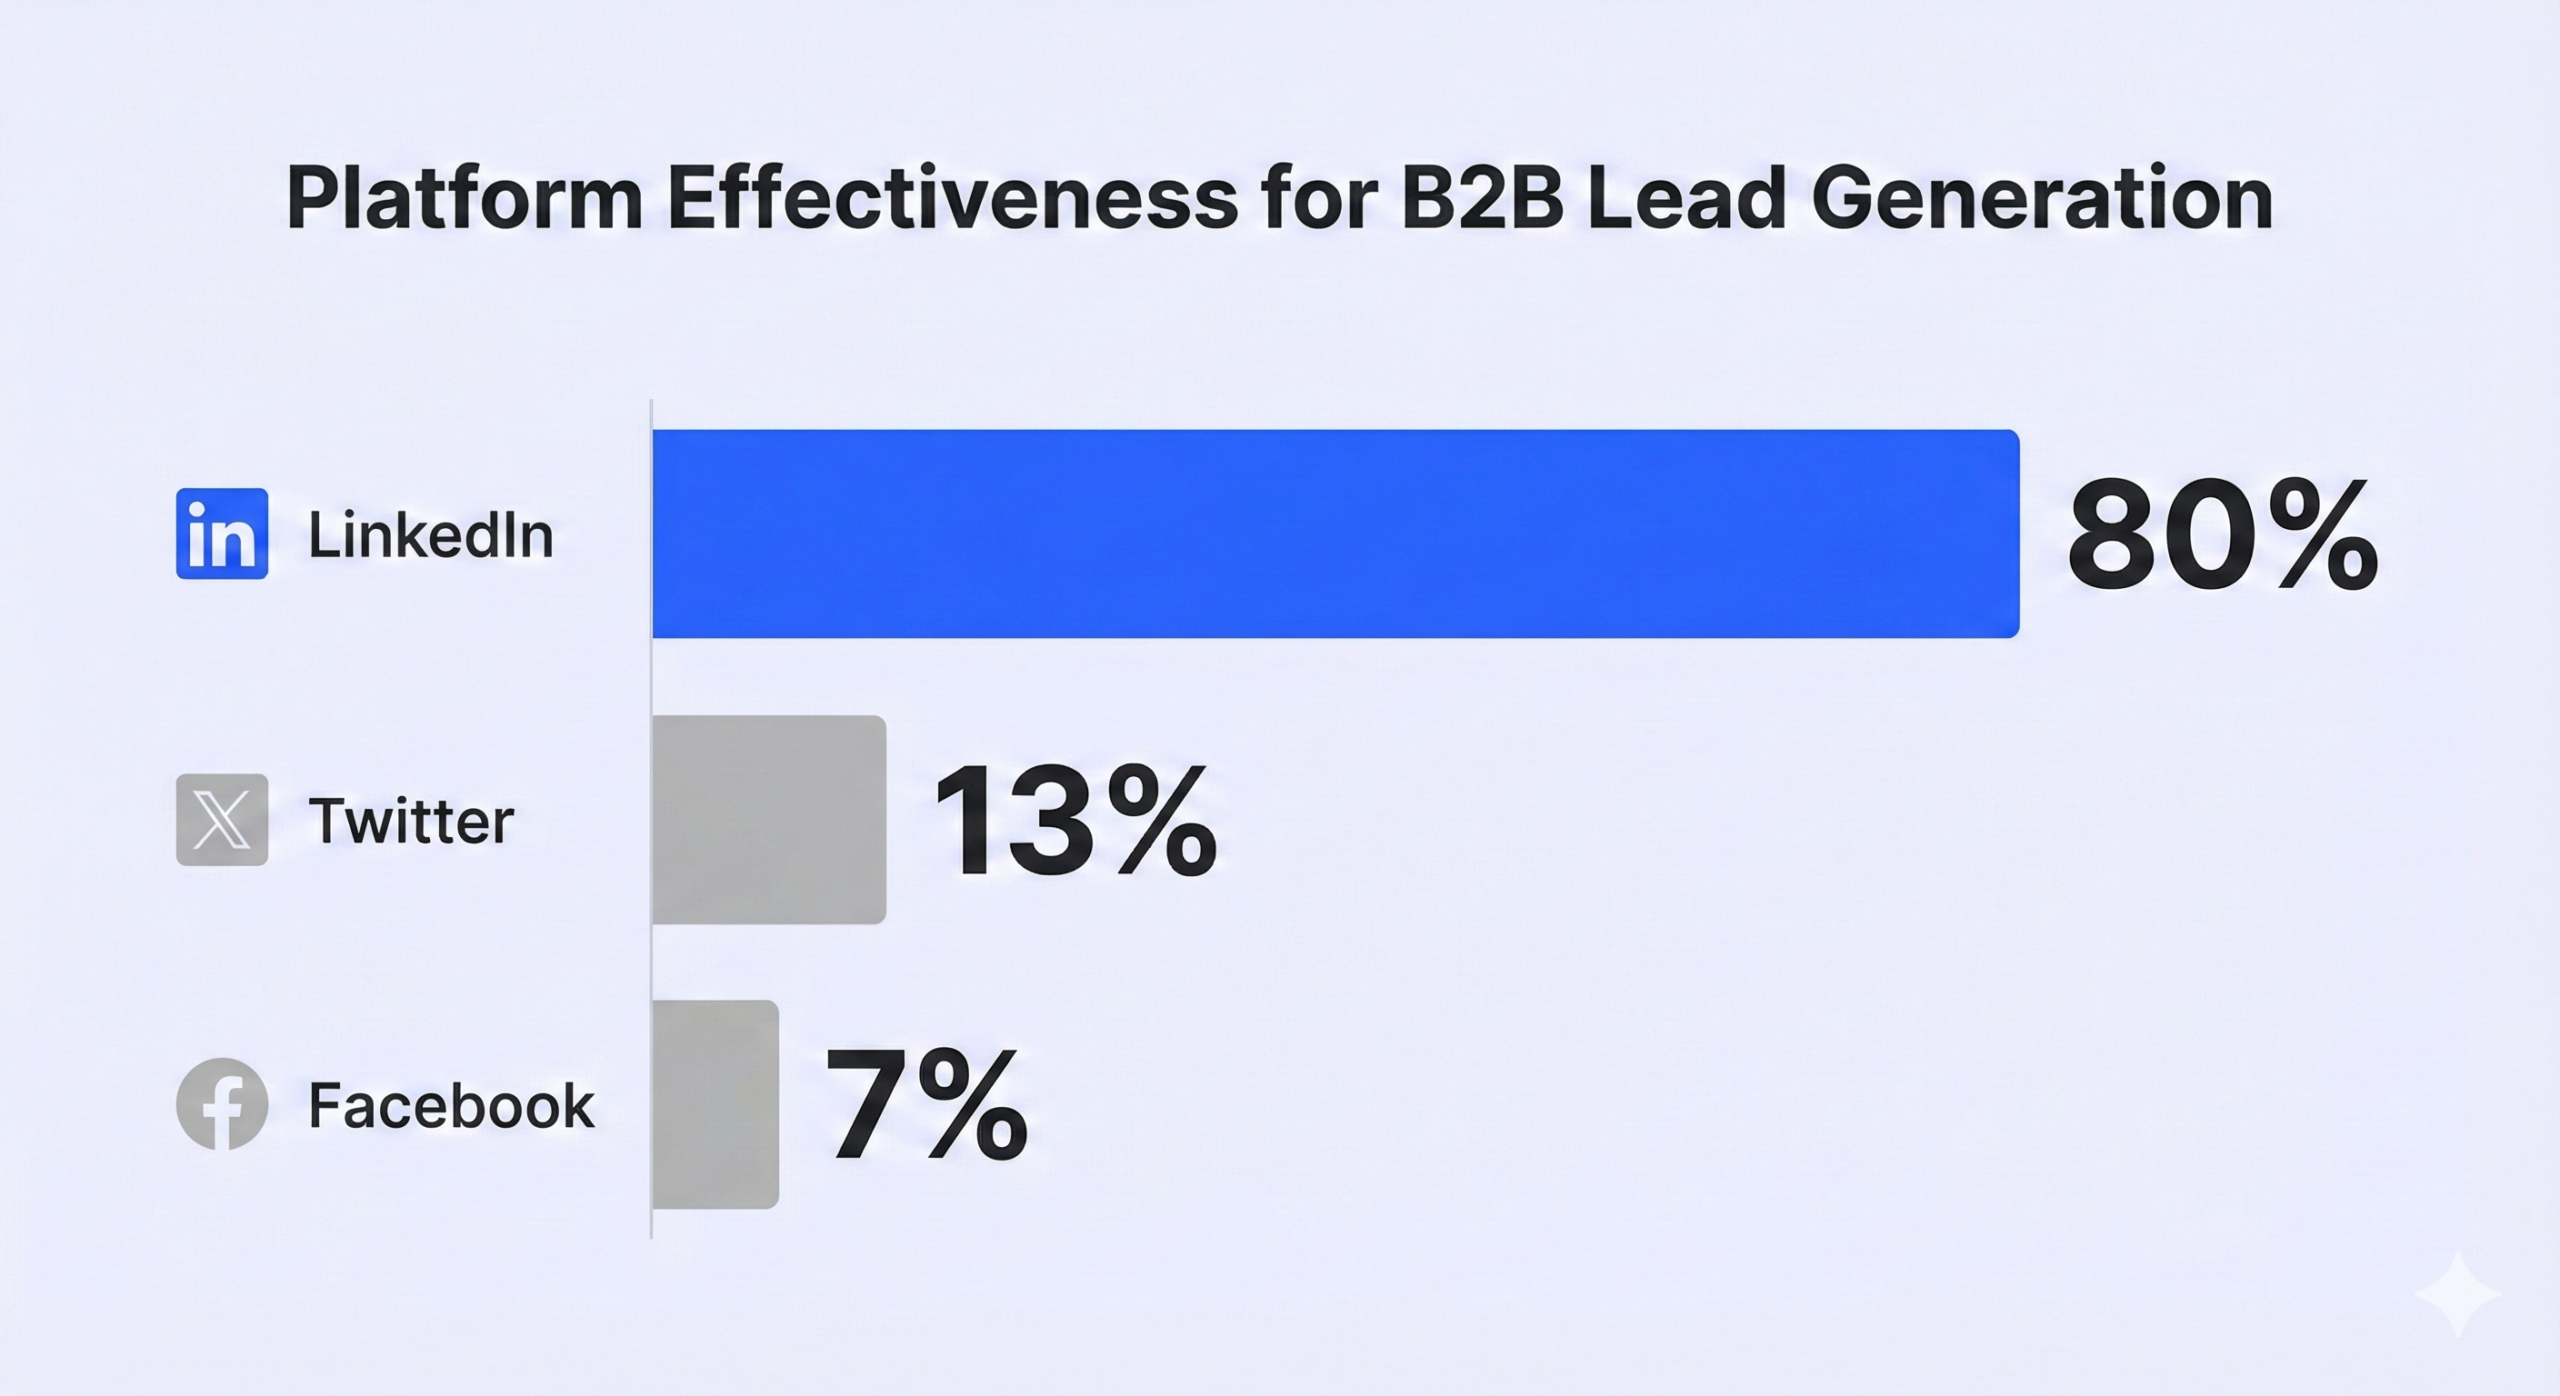
The B2B Lead Generation Context
Supply only matters if demand exists. For professional services, LinkedIn’s numbers prove the buyers are here.
Decision-Maker Concentration
LinkedIn hosts 65 million business decision-makers—C-Suite executives, VPs, and Directors with budget authority. Beyond check-writers, 4 out of 5 LinkedIn members drive business decisions in some capacity.
This matters for complex B2B sales where you need to engage multiple stakeholders. The technical evaluator might not sign the contract, but they influence it.
💼 Access All 65M Decision-Makers
Our LinkedIn outbound engine combines precise targeting, proven campaigns, and systematic scaling for 15-25% response rates
Comparative Lead Performance
When benchmarked against other channels, LinkedIn dominates B2B outcomes:
- 80% of B2B social media leads come from LinkedIn
- Twitter/X generates just 13%
- Facebook contributes only 7%
For cold outreach specifically:
- LinkedIn InMail averages 18-25% response rates
- Traditional cold email typically sees 3% or less
The conversion rate for LinkedIn Lead Gen Forms averages 13%, compared to standard B2B landing pages at 2.35%. That’s a 5.5x performance differential.
Cost Dynamics
LinkedIn’s Cost Per Click runs higher ($5-$15), but the Cost Per Lead is 28% lower than Google AdWords. Fewer clicks get wasted on irrelevant users, improving bottom-line acquisition cost.
Service Request Trends
The demand side is growing faster than supply:
- 65% year-over-year increase in service requests
- 73% of hiring managers plan to maintain or increase freelancer reliance
This “demand surplus” is driven by macro factors. U.S. hiring sits 20% below pre-pandemic levels as of August 2025, with full-time hiring down 4% year-over-year. Companies are freezing FTE budgets but still need work done—they’re pivoting to flexible talent solutions.
The global outsourcing market is projected to reach $450 billion by 2025.
Platform Comparison: LinkedIn vs. Upwork/Fiverr
How does LinkedIn’s marketplace stack up against dedicated freelance platforms?
Feature | LinkedIn Services Marketplace | Upwork / Fiverr |
Commission | 0% (Free) | 10-20% of earnings |
Lead Cost | $0 organic or Premium subscription | “Connects” fees / Bidding costs |
User Quality | Verified professionals (1B+ users) | Mix of verified & anonymous |
Buyer Type | Decision-makers (65M+) | Project managers / SMB owners |
Focus | B2B / Long-term relationships | Transactional / Gig-based |
The zero-fee advantage is massive. A consultant billing $100,000 annually saves $10,000-$20,000 in platform fees by using LinkedIn over Upwork. This economic incentive attracts premium talent, which attracts premium buyers.
LinkedIn is relationship-focused. Buyers want expertise that drives decisions. Upwork and Fiverr are task-focused—hands to execute discrete projects.
🚀 Beyond the Marketplace Model
Why compete with 10M providers when you can proactively message decision-makers? Our complete outbound strategy bypasses marketplace limitations
7-day Free Trial |No Credit Card Needed.
What These Statistics Mean for You
The LinkedIn Services Marketplace statistics reveal a platform at scale but also at saturation. 10 million providers competing for 8 requests per minute means relying solely on inbound marketplace leads is playing a numbers game.
The winning move? Combine marketplace presence with proactive outreach. LinkedIn’s 65 million decision-makers are accessible through direct messaging, not just service requests. With response rates of 15-25% for well-crafted LinkedIn outbound (versus 1-5% for cold email), the math favors going direct.
The data shows demand is there. The hiring slowdown is pushing 73% of managers toward flexible talent. You just need to position yourself in front of them before they post a marketplace request that gets buried under hundreds of proposals.
Conclusion
LinkedIn ProFinder statistics paint a clear picture: the platform has evolved from a curated marketplace of 50,000 in 2016 to a massive Services Marketplace of 10 million providers today. Growth is accelerating at 48% year-over-year, with service requests up 65%.
But scale creates competition. Standing out in a marketplace of 1 million consultants or 685,000 marketers requires more than a polished profile. It requires strategic positioning, niche specialization, and most importantly—proactive outreach to the 65 million decision-makers who might never browse the marketplace at all.
The statistics are on your side. LinkedIn generates 80% of B2B social leads, delivers 13% conversion rates, and costs 28% less per lead than Google AdWords. The opportunity is massive. The question is whether you’ll wait for buyers to find you or go find them first.
FAQs
How many freelancers are on LinkedIn Services Marketplace?
What is the commission fee for LinkedIn Services Marketplace?
How many service requests does LinkedIn get?
Which service categories have the most providers?
How does LinkedIn compare to Upwork for freelancers?
- blog
- Statistics
- LinkedIn ProFinder Statistics 2026: Services Marketplace Data