
If you’re searching for “LinkedIn Stories statistics,” here’s what you need to know: LinkedIn Stories were discontinued on September 30, 2021. They lasted barely a year before the platform pulled the plug.
But here’s the thing—LinkedIn Stories didn’t fail because video was a bad idea. They failed because professionals wanted something completely different. And what replaced Stories is actually far more powerful for building your network and generating business opportunities.
Let’s break down what happened, what the data tells us, and most importantly, what you should be doing instead.
What Happened to LinkedIn Stories?
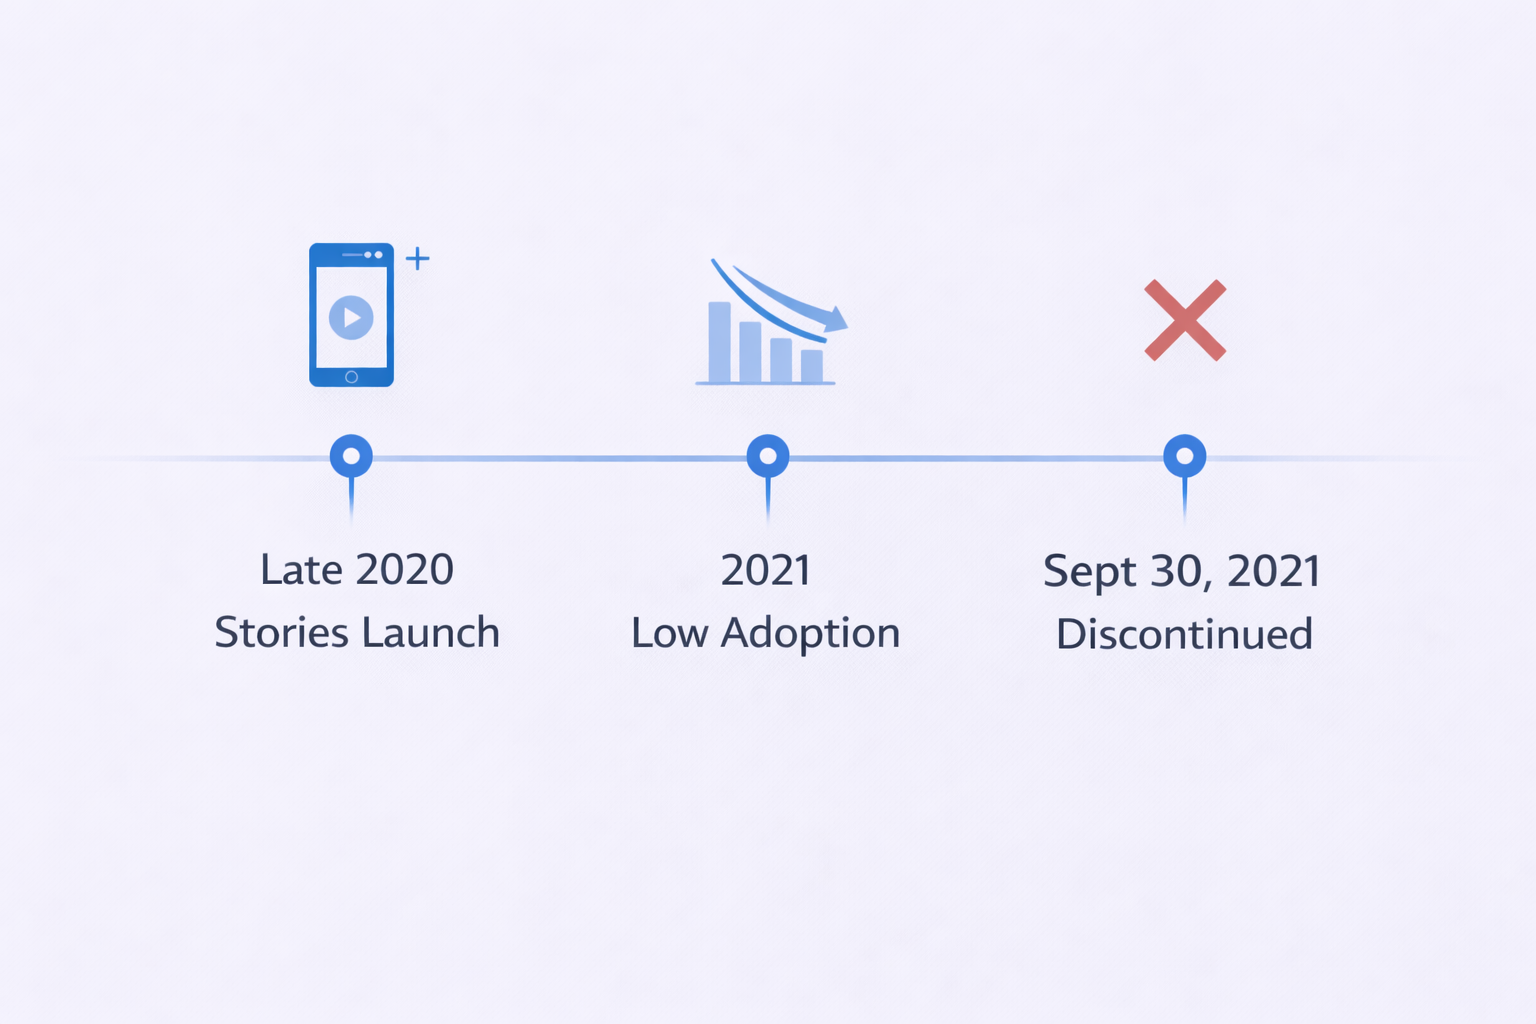
LinkedIn Stories launched globally in late 2020, riding the wave of ephemeral content that dominated Instagram and Snapchat. The concept was simple: post photos or short videos that disappeared after 24 hours.
The execution? Not so simple.
The feature lasted exactly 364 days. LinkedIn officially removed Stories on September 30, 2021, citing clear user feedback: professionals wanted permanent content, not disappearing updates.
According to Liz Li, LinkedIn’s Senior Director of Product, internal data showed users didn’t want “informal” videos attached to their professional profiles that would vanish. They wanted to create “lasting videos” that showcased expertise permanently.
Think about it—when you spend time crafting a professional message, you want it to work for you indefinitely, not disappear in 24 hours. The LinkedIn growth hacking strategies that actually work focus on building lasting authority, not temporary visibility.
The Statistics Behind the Failure
The rejection of Stories wasn’t about poor execution—it was about product-market fit. Here’s what the data revealed:
Why LinkedIn Stories Failed:
- Professionals preferred permanent content over ephemeral (24-hour) posts
- Users felt Stories reduced the “gravity” of their professional brand
- High effort to create professional content wasn’t rewarded with long-term visibility
- Advertisers had limited inventory as organic usage remained low
The Format Mismatch:
What Stories Offered | What Professionals Wanted | Result |
24-hour lifespan | Permanent archival | Rejection |
Casual, raw tone | Professional, informative | Friction |
FOMO-driven | Knowledge retention & ROI | Mismatch |
Low-effort spontaneous | High-effort strategic | Low adoption |
This wasn’t unique to LinkedIn. Twitter shut down its Stories clone “Fleets” just two months earlier in July 2021. The message was clear: professionals enforce a boundary between entertainment platforms and information platforms.
Stories taught LinkedIn a crucial lesson: the format (vertical video) was a winner, but the delivery mechanism (disappearing content) was a loser.
What Replaced LinkedIn Stories (And Why It’s Better)
LinkedIn didn’t kill video—they evolved it. Enter the Immersive Video Feed, LinkedIn’s answer to TikTok and Instagram Reels, but with a professional twist.
The statistics show this pivot was the right move.
The Video Revolution Stats:
- Video viewership increased 36% year-over-year between late 2024 and early 2025
- Users create video content at 2x the rate of other formats
- Video posts generate 5x higher interaction rates than text or image posts
- LinkedIn users are 20x more likely to share video than any other content type
That last stat is critical. Every share extends your reach beyond first-degree connections, exposing your message to second and third-degree networks without needing connection requests. For anyone serious about advanced LinkedIn search strategies, video amplification is the fastest growth lever.
LinkedIn Newsletters vs Articles: The Long Game
For building sustained authority and visibility, LinkedIn offers two long-form options: Newsletters and Articles. The statistics heavily favor one.
Newsletter Statistics:
- Over 184,000 newsletters exist on LinkedIn (as of 2025)
- Over 28 million members subscribe to at least one newsletter
- Median open rate: 49.3% (vastly higher than typical email marketing)
- Subscribers receive both push notifications and email alerts
Compare that to traditional email marketing where open rates hover around 20-25%, and you’ll see why newsletters are exploding.
Articles for SEO: LinkedIn Articles (long-form blog posts) serve a different strategic purpose: search engine optimization. LinkedIn’s domain authority is 99/100, making Articles rank highly on Google.
Use Newsletters for community building and immediate engagement. Use Articles for evergreen content designed to be found via search months or years later. Both strategies complement aggressive inbox placement tools for integrated outbound campaigns.
Social Selling Statistics: The Revenue Connection
If you’re using LinkedIn for business development, the Social Selling Index (SSI) isn’t a vanity metric—it’s a revenue predictor.
SSI Performance Stats:
- Sales reps with high SSI are 51% more likely to hit quota
- High SSI reps generate 45% more sales opportunities
- 78% of social sellers outperform peers who don’t use social media
The Connection Request Debate
Should you include a note with connection requests? The data presents a paradox.
No Note Strategy:
- Acceptance rate: 31% (some data suggests up to 89% higher than “salesy” notes)
- Psychology: Blank requests feel like curiosity clicks, not sales pitches
Personalized Note Strategy:
- Highly personalized requests: 45% acceptance rate
- Generic templates: as low as 15% acceptance rate
- “Honest Sales Message” resulted in 6.62% qualified call booking rate vs 3.77% for “No Note”
The Verdict: If your goal is network expansion, send blank requests. If your goal is booked calls and revenue, send hyper-personalized notes. Generic templates are the worst of both worlds.
InMail vs Connection Requests
InMail Statistics:
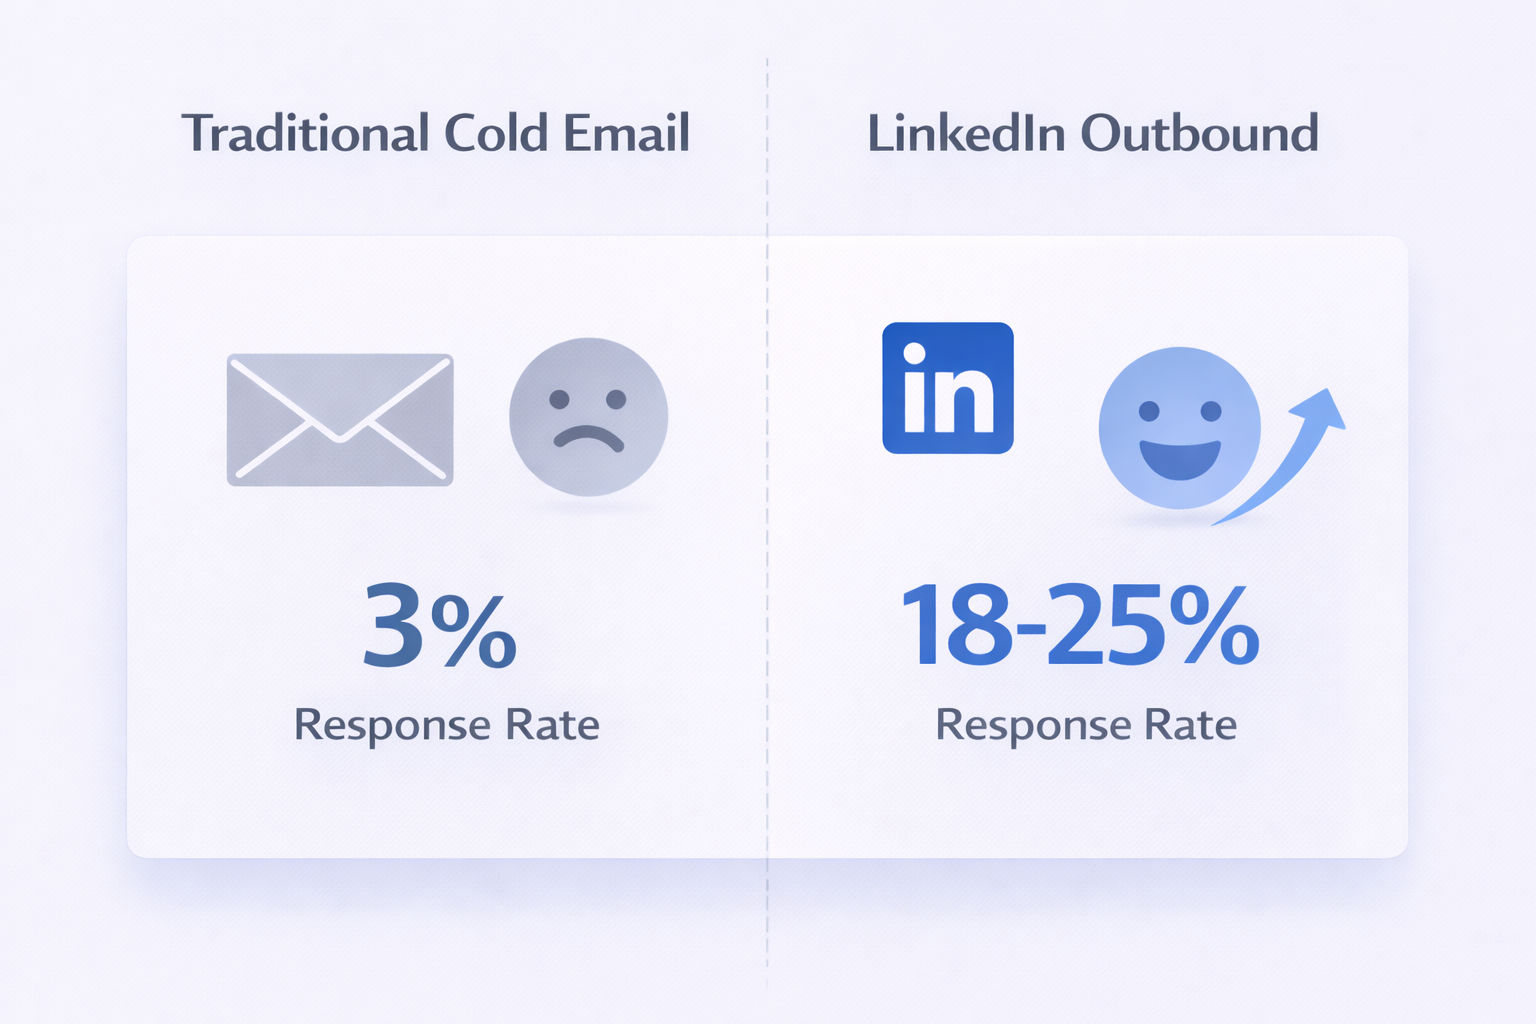
- Response rates: 18-25% (compared to ~3% for cold email)
- 300% more effective than traditional email for responses
Reserve InMail credits for high-value targets (C-suite executives) where a standard connection request might get ignored. For volume prospecting, connection requests remain the workhorse—especially when you’re targeting specific titles using methods like how to get phone numbers from LinkedIn.
Lead Gen Forms and Privacy Protocols
LinkedIn’s Lead Gen Forms auto-populate user data, creating a seamless conversion experience with 13% average conversion rate (compared to 2-3% for landing pages).
Lead Gen Form Performance:
- 90% of pilot customers beat their Cost-Per-Lead goals
- Conversion rates 3x higher than sponsored content sending traffic off-platform
Agreement Privacy Requirements: When setting up Lead Gen Forms, you’re acting as a “data controller” and must include:
- Link to your privacy policy (2000 character limit)
- Clear consent checkboxes
- Explicit statements about data usage (email outreach, newsletters, etc.)
This isn’t optional—it’s required for GDPR/CCPA compliance. The cookie policy and join sign process must be transparent. For businesses exploring Apollo.io alternatives, understanding these privacy requirements is critical for LinkedIn lead capture.
Trust Statistics:
- 62% of B2B buyers trust LinkedIn content
- Abusing Lead Gen Form data violates both LinkedIn terms and privacy laws
The agreement privacy link isn’t just legal compliance—it’s the foundation of deliverability when those leads enter your cold email sequences.
LinkedIn’s Demographic Goldmine
LinkedIn isn’t just for job seekers—it’s the wealthiest social demographic, making it ideal for high-ticket sales.
User Base Statistics:
- Over 1.1 billion members globally (early 2025)
- 3 new members every second
- USA: ~230-250 million users
- India: ~135-150 million users (fastest growing)
The Wealth Factor:
- 53-54% of U.S. users belong to high-income households ($100k+/year)
- Over 65 million decision-makers on the platform
- 10 million C-level executives
- 4 out of 5 people on LinkedIn drive business decisions
- Core demographic: 25-34 years old (50-60%)
Translation? Your content reaches an educated, affluent audience with budget authority. Understanding LinkedIn user statistics helps refine targeting for maximum ROI.
The Algorithm: Timing and Engagement
To rank in the LinkedIn feed, you need to understand what the 2025 algorithm prioritizes.
Timing Statistics:
- First 60-90 minutes after posting are critical
- Posts with early engagement are 4.1x more likely to reach wider audiences
- Replying to comments within the first hour increases total comments by 34%
Comment Engagement:
- Replying to comments boosts overall engagement by 30%
- Comments with 15+ words receive 2.5x more algorithmic weight than short replies
- The algorithm rewards conversations, not just broadcasting
Posting Frequency:
- Pages posting weekly see 5.6x more follower growth than monthly posting
- Sweet spot: 1-2 posts per day
- Best times: Tuesday, Wednesday, Thursday between 9 AM-12 PM
Posting more than twice daily can cannibalize your own reach—the algorithm rarely shows multiple posts from the same creator to the same user in one session.
What to Do Instead of LinkedIn Stories
The data makes the strategy clear:
- Embrace Vertical Video Create 30-60 second vertical videos for the Immersive Feed. With 20x higher share rates than text posts, this is your fastest reach multiplier.
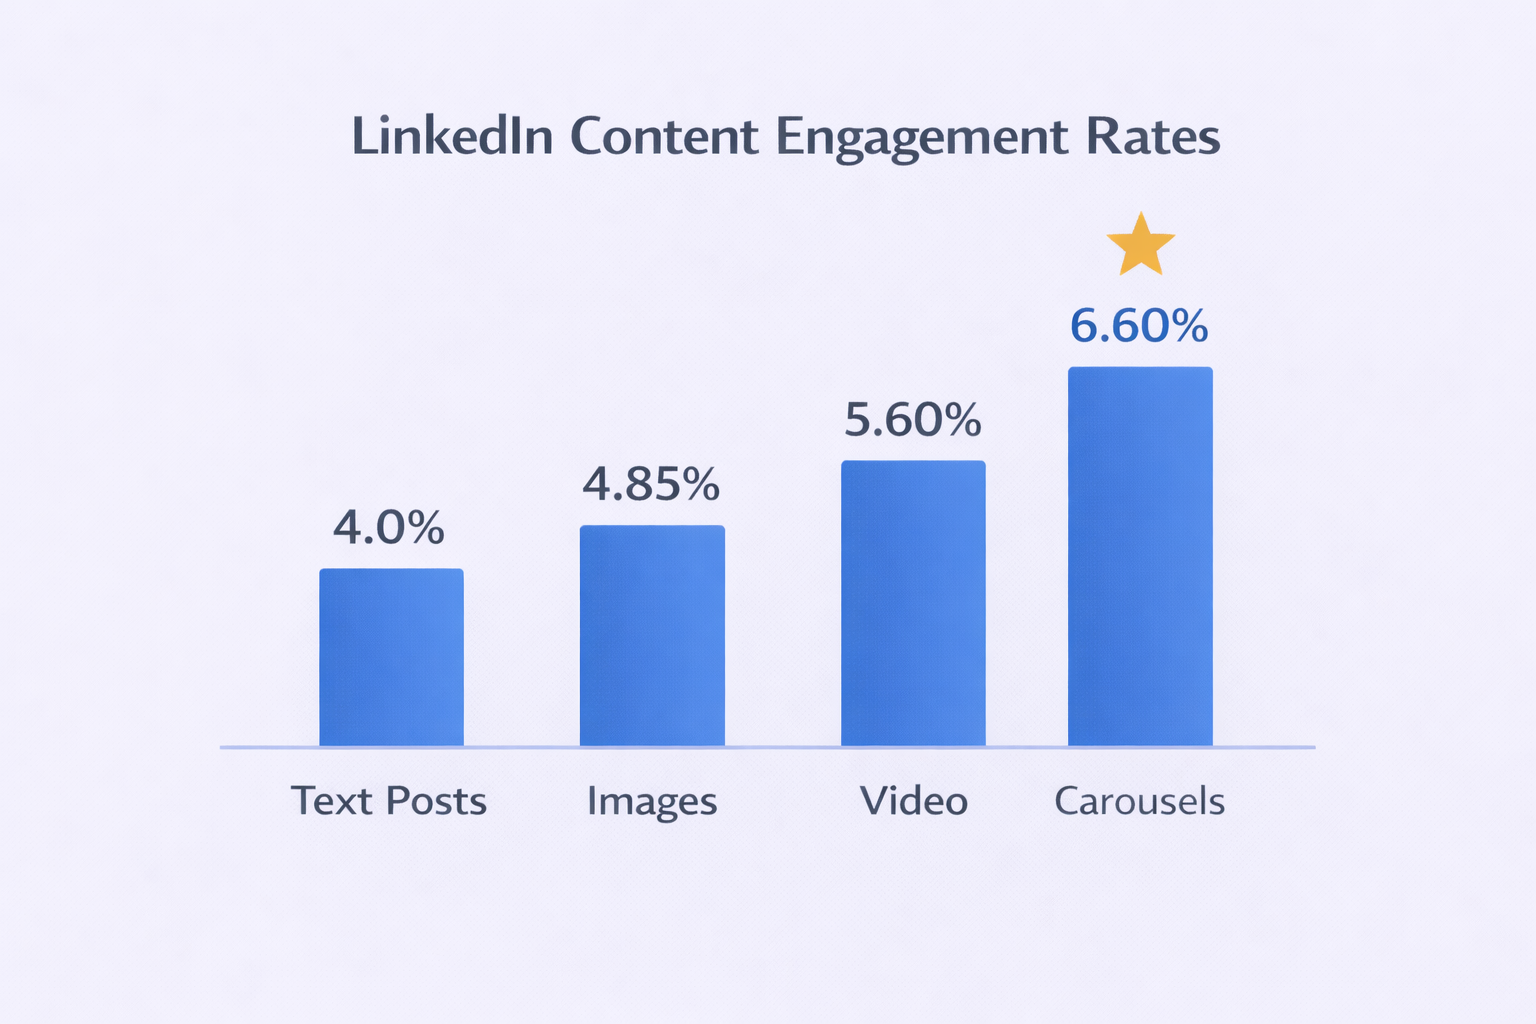
- Leverage Carousels for Education With a 6.6% engagement rate, PDF carousels are your most effective tool for explaining complex solutions and building authority.
- Build Through Newsletters Launch a LinkedIn Newsletter for a 49.3% median open rate—far superior to traditional email marketing.
- Personalize Connection Strategy Go blank for volume or hyper-personalized for conversion. Avoid generic templates entirely.
- Use Native Features Upload directly to LinkedIn rather than linking out. The platform rewards keeping users on-platform.
The “Story” of LinkedIn is no longer about 24-hour updates—it’s about permanent, visual storytelling that builds your professional brand and generates real business opportunities.
When you align with these statistics, you don’t just participate in the feed—you dominate it.
