

Hey there, sales pros! Ever feel like you’re shooting in the dark when reaching out to ecommerce businesses? Understanding their world, especially how they’re spending big on ads, can be your secret weapon. These aren’t just numbers; they’re clues to your prospect’s challenges, goals, and where they’re investing. Knowing these ecommerce statistics can help you tailor your pitch, ask smarter questions, and ultimately, close more deals.
Simply put, ecommerce advertising is all about promoting online stores and products to drive sales through digital channels. Think about it: if a prospect is pouring money into social media ads but their industry typically sees low conversion from that channel, they might be hungry for solutions that improve lead quality or outreach effectiveness—perhaps like better email campaigns driven by high-quality contact data.
In this article, we’ll break down the key advertising statistics for ecommerce, making them easy to grasp and, more importantly, easy for you to use. Let’s dive in!
Digital Advertising: Key Highlights
To kick things off, let’s look at some headline figures that paint a picture of the ecommerce advertising landscape. These stats show just how dynamic and significant this space is:
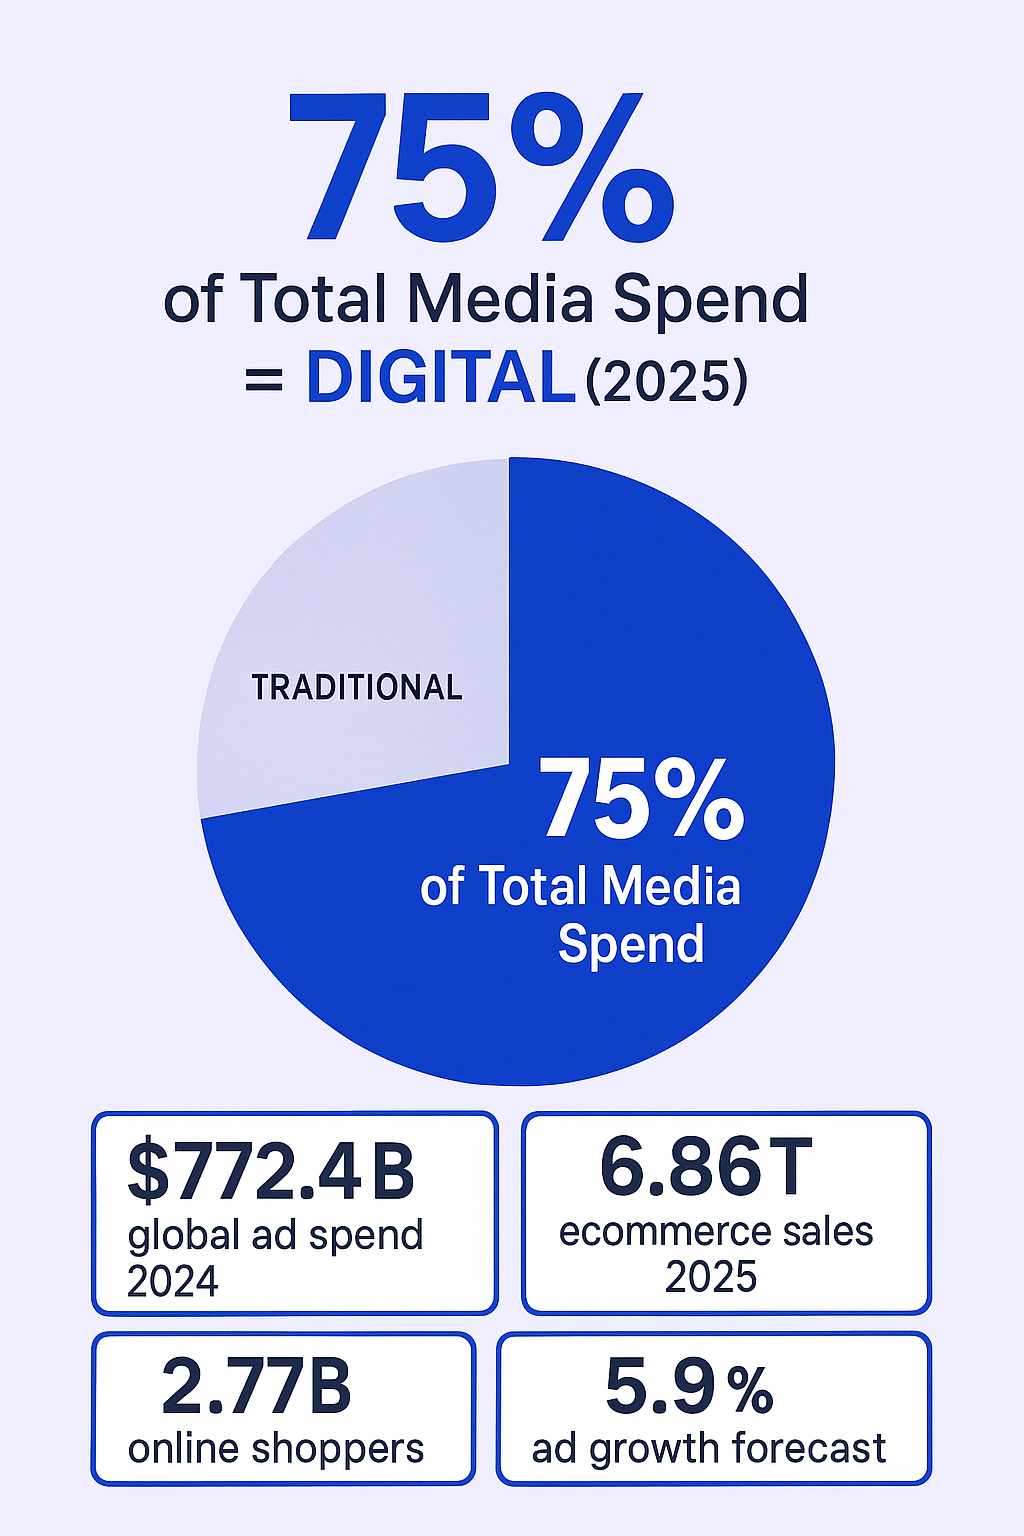
- Digital ad spending will account for more than 75% of worldwide total media ad spending for the first time in 2025
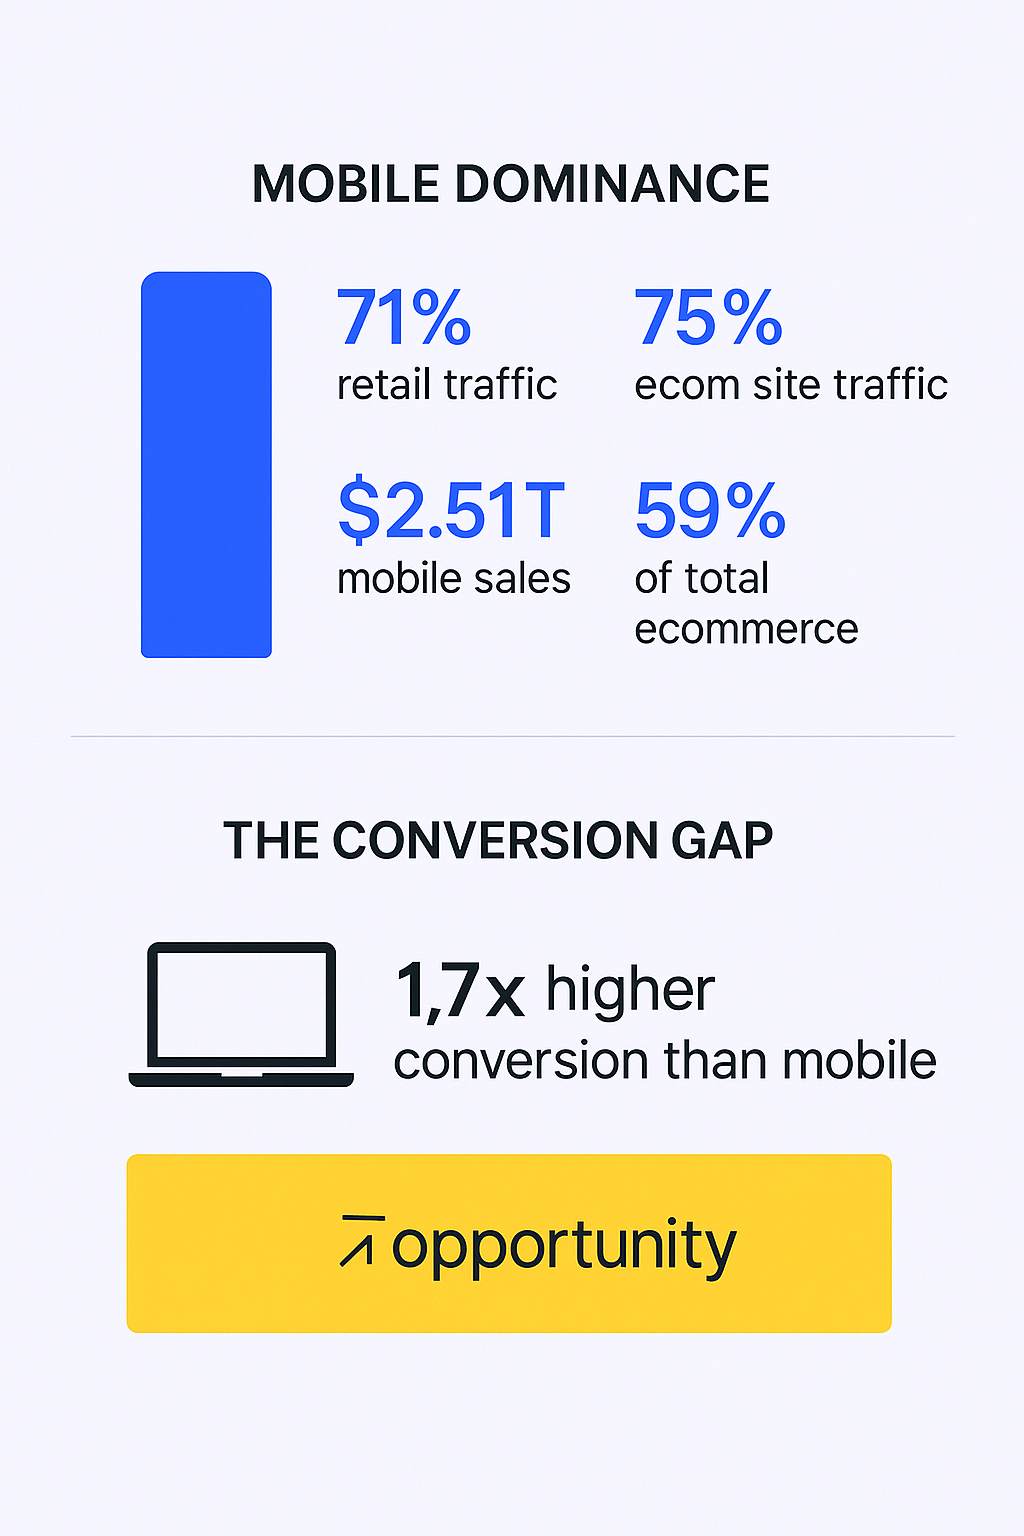
- Mobile devices account for 71% of retail traffic worldwide and mobile ecommerce accounts for nearly half (44.1%) of US online sales in 2024, representing $564.1 billion in order value
- Online stores that also have a social media presence have, on average, 32% more sales than those not using social media
- Digital video is set to capture nearly 60% of all U.S. TV/video ad spend in 2025, a staggering leap from just 29% in 2020
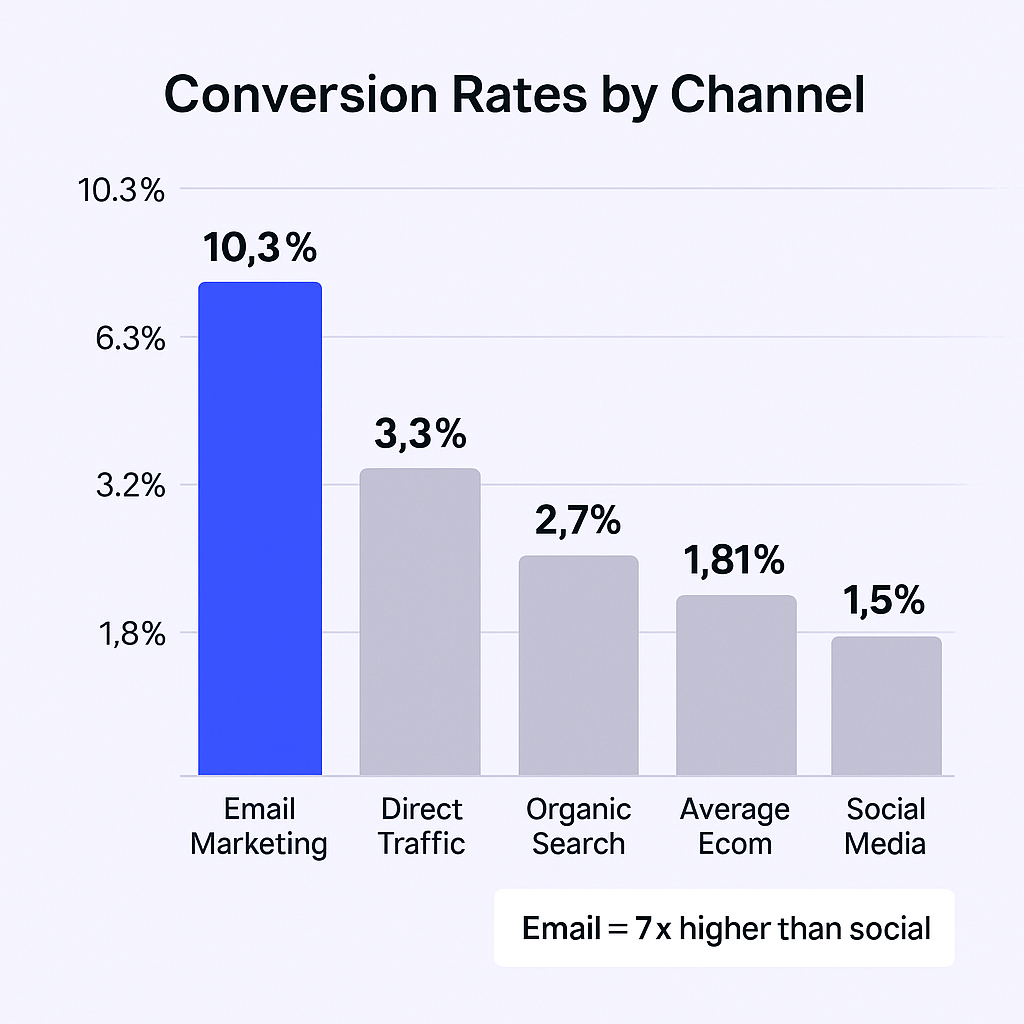
- Email marketing has an average conversion rate of 10.3% thanks to its highly segmented and personalized nature. This explains its high ROI—36 to 40$ for every dollar spent
Impressed? These are just the headlines.
These big numbers indicate a thriving, competitive market. Businesses are spending significantly, which means they are under pressure to see results. This creates opportunities for solutions that enhance their advertising ROI or provide complementary lead generation. Let’s dig deeper into what these numbers mean for the ecommerce world and, more importantly, for you.
Digital Advertising Statistics — Ad Spend And Budgets
The digital ad market isn’t just growing; it’s exploding. Global advertising spend for 2024 reached $772.4 billion with Ad spend growth forecast to continue at 5.9% in 2025, making digital the dominant force in media spending.
Global eCommerce sales will account for $6.86 trillion in 2025, which is an 8.37% increase from 2024. Even more impressive, the global ecommerce market is expected to total $4.8 trillion in 2025 with about 23% of total retail sales happening online by 2027.
This massive ad spend is fueled by the sheer size of the ecommerce market itself. There are 2.77 billion global online shoppers as of 2025, and 21% of retail purchases are expected to take place online in 2025, rising to 22.6% by 2027.
Looking at specific investment areas, retail media is leading the way at +21.9% year-over-year growth as advertisers capitalize on the high value of retailer consumer data. Meanwhile, paid search is expected to increase by 6.7% driven by continuous advancements in AI-powered features.
What This Means for You (BDRs & AEs):
When you see these colossal spending figures, understand that your ecommerce prospects are under immense pressure to get a return on that investment. High ad spend without corresponding sales growth is a major pain point. This pressure cooker environment means businesses are not just spending more; they’re desperately seeking ways to spend smarter.
If a prospect mentions budget constraints for new tools, but you know their industry is heavily investing in ads, you can frame your solution as a way to optimize their existing, significant ad spend or to capture leads that their ads might be missing. For instance, if they’re spending heavily on ads but their sales team is struggling with lead quality, providing high-quality, verified email addresses for targeted email marketing campaigns could be a highly valuable complementary strategy.
Social Media Advertising Statistics
Social media isn’t just for sharing updates with friends; it’s a sales powerhouse for ecommerce. Global spend on social media ads increased by 15 percent compared with 2023, with marketers spending close to a quarter of a trillion US dollars on social media ads in 2024.
But does it actually work for driving sales? The numbers speak for themselves. Online stores that also have a social media presence have, on average, 32% more sales than those not using social media. Furthermore, 50.6% of social media users in the US have made at least one purchase via social channel in 2025.
Platform performance varies significantly:
- Facebook: $65 is the average order value for customers who have been referred to an online shop via Instagram. The average for Facebook is $55
- Instagram: Continues to drive strong engagement and sales
- TikTok: Social media expects double-digit growth (+11.9%) with strong Gen Z engagement
- YouTube: Remains a key player for video content
64% of Gen Z, 59% of Millennials, and 47% of Gen X uses social media to discover new products, making it clear that social media platforms are essential for product discovery across generations.
What This Means for You (BDRs & AEs):
Your ecommerce prospects are almost certainly using social media advertising. Don’t hesitate to ask them which platforms they’re on and what kind of results they’re seeing. This can open doors to discuss their challenges and where they might need help.
If they’re successfully driving traffic but not leading to sales, they might need better systems for converting that traffic. This could involve targeted email marketing to nurture those leads, for which accurate contact data is essential.
