
This comprehensive guide breaks down the most important Thanksgiving ecommerce statistics, revealing exactly where consumers spent their money, how they shopped, and what it means for your business strategy.
Key Thanksgiving Ecommerce Statistics
The 2024 holiday season delivered record-breaking results that exceeded all expectations. Here are the headline numbers that defined this shopping period:
- $241.4 billion – Total U.S. online holiday spending (November 1 – December 31)
- 8.7% year-over-year growth – Showing a thriving, healthy market
- $41.1 billion – “Cyber Five” total (Thanksgiving through Cyber Monday)
- $6.1 billion – Thanksgiving Day online sales alone
The data from adobe analytics reveals something fascinating: this wasn’t just about more people shopping online. The entire shopping calendar has fundamentally shifted. 60% of consumers now start their holiday shopping before Thanksgiving, with major retailers launching campaigns as early as October 10th.
What does this mean for your business? The traditional “Black Friday weekend” strategy is dead. Success now requires a marathon approach, not a sprint.
Thanksgiving Shopping Trends
Three major forces shaped how consumers shopped in 2024, creating both challenges and opportunities for online retailers.
AI-Powered Shopping Takes Center Stage
Artificial intelligence moved from buzzword to revenue driver. Retailers using AI-powered chatbots saw a 9% higher conversion rate compared to those without. Even more impressive: AI influenced 19% of all online holiday orders, and chatbot referrals to retail sites exploded by 1,300%.
The Sustainability Movement
“Green Friday” emerged as a powerful counter-narrative to traditional mass discounting. Values-driven consumers are making purchasing decisions based on ethical sourcing and eco-friendly practices, not just price.
Experience Over Products
Consumers increasingly prefer spending on experiences—travel, concerts, events—over physical goods. This shift impacts gifting choices, with shoppers seeking unique, memorable presents rather than commodity items.
The modern shopper is a “calculated contradiction”—simultaneously more price-sensitive and more values-driven than ever before. While 70% expected higher prices and traded down on groceries, 52% deliberately shopped at small businesses to find unique gifts.
Thanksgiving Day Sales Statistics
Thanksgiving Day has evolved from a family-focused holiday into a major shopping event. The $6.1 billion in online sales represents an 8.8% increase from 2023, with a fascinating pattern emerging.
35% of all Thanksgiving Day purchases happen after 5 PM as festivities wind down and families relax with their devices. This “couch commerce” phenomenon creates a predictable, highly profitable micro-moment.
Email marketing drives 25% of all Thanksgiving Day conversions, making it the most effective channel for this specific window. The timing is everything—campaigns hitting inboxes around 6 PM EST convert at dramatically higher rates than morning sends.
Thanksgiving Weekend Shopping Statistics
The five-day “Cyber Five” period remains the most intense shopping window of the year. Here’s how each day performed:
Thanksgiving through Cyber Monday Breakdown:
- Thanksgiving Day: $6.1 billion (+8.8% vs 2023)
- Black Friday: $10.8 billion (+10.2% vs 2023)
- Weekend (Sat/Sun): $10.9 billion (+5.8% vs 2023)
- Cyber Monday: $13.3 billion (+7.3% vs 2023)
Total Cyber Five: $41.1 billion (+8.2% vs 2023)
These numbers reveal that Black Friday and Cyber Monday are developing distinct personalities. Black Friday has become the ultimate omnichannel battleground where digital and physical retail merge. Cyber Monday solidified its identity as the mobile-first, pure-play digital champion.
During Cyber Monday’s peak hours (8-10 PM EST), shoppers spent an astounding $15.8 million every minute.
Black Friday Statistics
Black Friday sales generated $10.8 billion online, but the real story was the synergy with physical stores. A record 81.7 million people shopped in physical stores, up from 76.2 million in 2023.
This proves that black friday online success and in-store traffic are now interconnected. The strongest retailers deployed omnichannel strategies, using online promotions to drive foot traffic and in-store experiences to boost digital engagement.
The surge in Buy Online, Pick Up in Store (BOPIS) services illustrates this integration perfectly. 70% of BOPIS shoppers made additional purchases once they arrived at the store.
Cyber Monday Statistics
Cyber Monday retained its crown as the biggest online shopping day, pulling in $13.3 billion. The mobile dominance was staggering: $7.6 billion (57%) of all purchases happened on smartphones.
This represents a dramatic shift from 2019, when mobile accounted for just 33% of Cyber Monday sales. The mobile-first mandate is no longer optional—it’s survival.
Key Cyber Monday Mobile Stats:
- 57% of total sales happened on mobile devices
- 79.1% of Buy Now, Pay Later transactions occurred on mobile
- $991.2 million in BNPL transactions on Cyber Monday alone
Small Business Saturday Statistics
While giants dominated headlines, Small Business Saturday proved the power of niche appeal. Consumers spent an estimated $17 billion at small businesses, driven by two key motivations:
- 47% wanted to support local communities
- 52% sought unique gifts unavailable at mass retailers
This isn’t about competing on price or logistics—it’s about story, curation, and connection. Small businesses that leaned into their unique value propositions thrived, while those trying to copy big-box strategies struggled.
Shopping Categories During Thanksgiving Weekend
Understanding where consumers spent their money reveals the hottest sectors and emerging opportunities:
Top Categories by Total Spend:
- Electronics: $55.3 billion (+8.8%)
- Apparel: $45.6 billion (+9.9%)
- Furniture/Home: $29.2 billion (+6.8%)
- Groceries: $21.5 billion (+12.9% – fastest growing)
- Cosmetics: $7.7 billion (+12.2%)
The surprise winner was the “trade-up” effect. Deep discounts didn’t just drive more purchases—they prompted consumers to buy premium items they’d always wanted. The most expensive goods within categories saw massive increases:
- Sporting Goods: +54%
- Electronics: +48%
- Appliances: +35%
A 30% discount on a $1,500 laptop feels more enabling than 30% off a $50 sweater. Smart retailers focused discounts on high-margin “hero” products to trigger this profitable behavior.
Mobile Shopping Statistics
Mobile commerce isn’t emerging anymore—it’s dominant. Smartphones drove 54.5% of all online holiday purchases, up from 51.1% in 2023. On Cyber Monday, mobile accounted for 57% of all sales.
This fundamental shift means mobile optimization isn’t a priority—it’s a prerequisite. Any friction in the mobile experience directly translates to lost revenue.
Critical Mobile Stats:
- 54.5% of holiday purchases happened on mobile
- $7.6 billion in Cyber Monday mobile sales
- 79.1% of BNPL transactions occurred on mobile devices
Online vs In-Store Shopping Statistics
The “online versus in-store” debate is over. Modern consumers move fluidly between channels, creating an integrated shopping journey.
Combined Shopping Numbers:
- 197 million Americans shopped over the five-day weekend
- 124.3 million shopped online
- 126 million shopped in-store (up from previous year)
The rise of omnichannel services proves this integration. Curbside pickup accounted for 37.8% of online orders in the days before Christmas, with 70% of BOPIS users making additional purchases in-store.
Consumer Behavior During Thanksgiving Shopping
Buy Now, Pay Later (BNPL) services emerged as a major spending enabler, driving $18.2 billion in online spending during the holiday season—a 9.6% increase from 2023.
BNPL Key Statistics:
- $18.2 billion total holiday spending through BNPL
- $991.2 million on Cyber Monday alone
- 79.1% of transactions happened on mobile
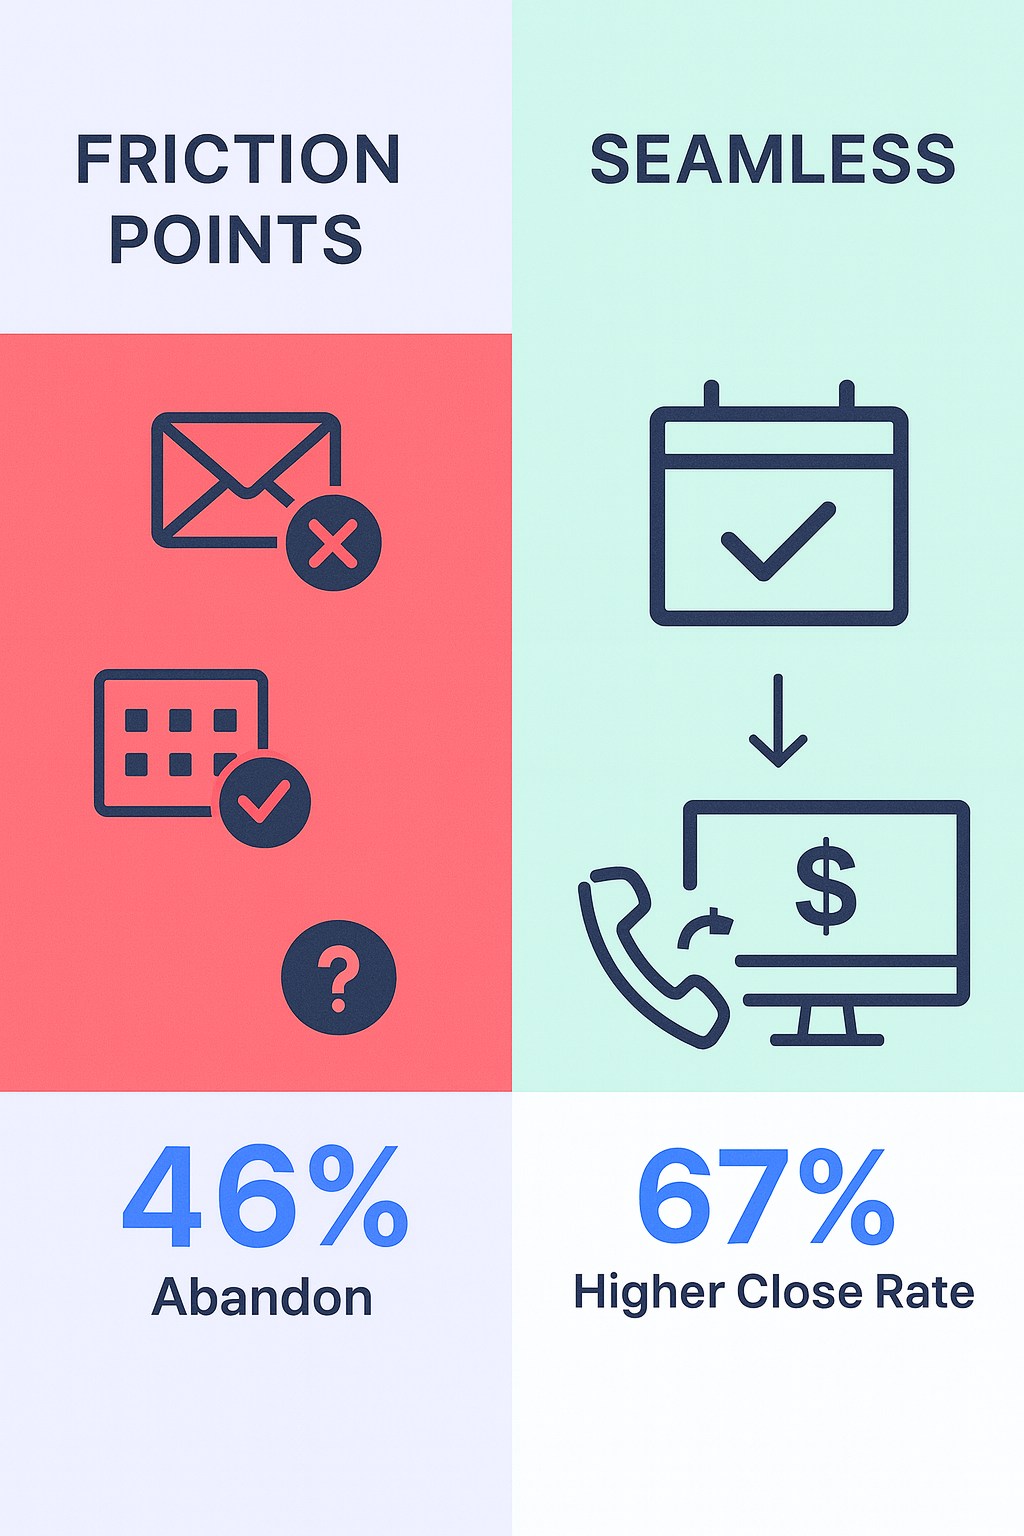
Free shipping remains the ultimate conversion driver. 80% of shoppers prefer free shipping, and unexpected shipping costs are the top reason for cart abandonment.
Marketing Statistics During Thanksgiving Weekend
Trust has become the ultimate currency in digital marketing. While paid search accounts for 28% of online retail revenue, the fastest-growing channel is affiliates and partners, including social media influencers.
Key Marketing Channel Stats:
- Paid search: 28% of revenue (largest single driver)
- Affiliates/influencers: 7-10% growth (fastest growing)
- Influencer conversion rate: 10x higher than social media overall
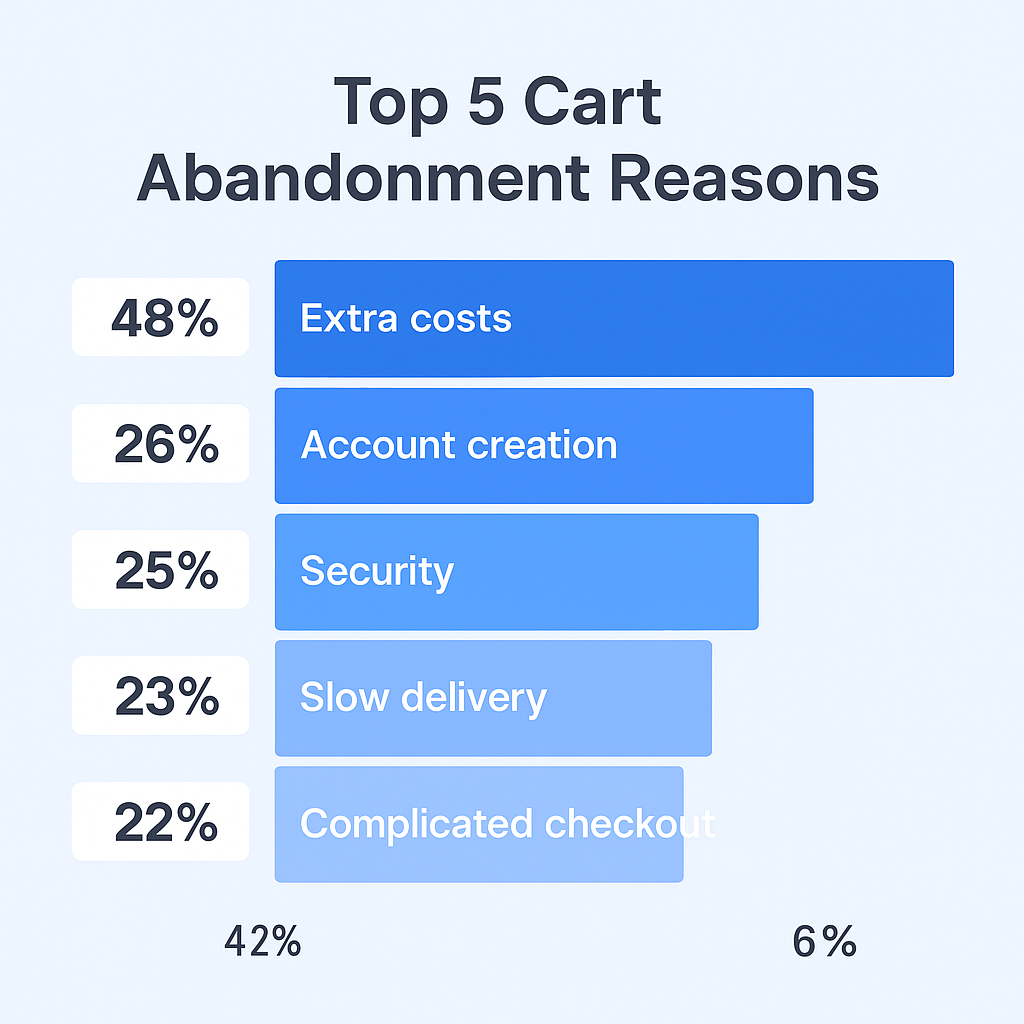
These issues are largely fixable with the right tools and strategies. Offering guest checkout, transparent pricing, and trust signals can dramatically improve conversion rates.
Future Predictions for Thanksgiving Shopping
Looking ahead, several trends will reshape the ecommerce landscape:
AI-Powered Personalization: Moving beyond chatbots to hyper-personalized product recommendations, dynamic pricing, and tailored marketing content for each individual shopper.
Social Commerce Evolution: Social platforms will become fully integrated storefronts with shoppable posts, livestream shopping events, and seamless in-app checkouts.
Sustainability as Standard: Eco-friendly practices will transition from niche differentiator to baseline consumer expectation across all categories.
Loyalty Over Discounts: As customer acquisition costs rise, businesses will shift from one-time discounts to building long-term customer relationships through subscriptions, exclusive perks, and community building.
The adobe analytics data suggests that successful retailers will focus less on single campaigns and more on continuous, personalized customer relationships. The future belongs to businesses that can build tribes, not just process transactions.
