🎉Find Prospects and Send Cold Emails & LinkedIn Outbound | All in One Place

Sales Pipeline Statistics That'll Actually Help You Hit Quota in 2025

Table of Contents

Sales pipeline statistice

  • 70% of buyers complete their research before talking to sales, fundamentally changing the modern sales approach
  • 75% of B2B buyers prefer a rep-free experience, demanding more precision in sales activities
  • Most sales reps spend only 2 hours per day actually selling, with the rest lost to administrative tasks
  • Cold email reply rates hit 5.1% in 2025, making quality contact data more critical than ever
  • Companies that respond within one hour see a 53% conversion rate vs 17% after 24 hours
  • MQL to SQL conversion rates range from 10-30% for most B2B teams, with top SaaS companies reaching 40%
  • Top teams achieve 59% SQL acceptance rate for outbound leads that enter active pipeline
  • Teams keeping sales cycles between 30-45 days achieve 38% higher velocity, averaging $2,134 per day
  • Sales cycles have increased 32% since 2021, requiring more strategic pipeline management
  • Average B2B win rate is only 21% across all qualified opportunities
  • Healthy teams maintain 3:1 to 4:1 pipeline coverage ratio to confidently hit quota targets
  • 90% of customer databases are incomplete, and 20% of records are basically useless
  • Poor data quality costs businesses $700 billion annually in lost opportunities and wasted time
  • Sales reps waste 21% of their day—nearly a full workday weekly—researching or correcting incomplete contact information
  • Outbound sequences targeting 100 recipients or fewer get 5.5% reply rates versus lower rates for bulk campaigns
 

Look, here’s the truth nobody wants to admit: 70% of buyers complete their research before ever talking to sales.

That old “spray and pray” approach? Dead. Buried. Not coming back.

The winners in 2025 are the teams using data to move faster, close smarter, and waste zero time on deals that were never going to close anyway.

This isn’t another boring stats dump. These are the metrics that separate quota-crushers from quota-missers, with real benchmarks you can actually use starting today.

What Are Sales Pipeline Metrics?

A sales pipeline metric measures how efficiently prospects move through your selling stages—from that first contact all the way to closed-won.

Think of it like this: your sales pipeline is a visual map showing where every deal sits right now. Are they in Discovery? Demo? Negotiation? Each stage tells you what needs to happen next to push that deal forward.

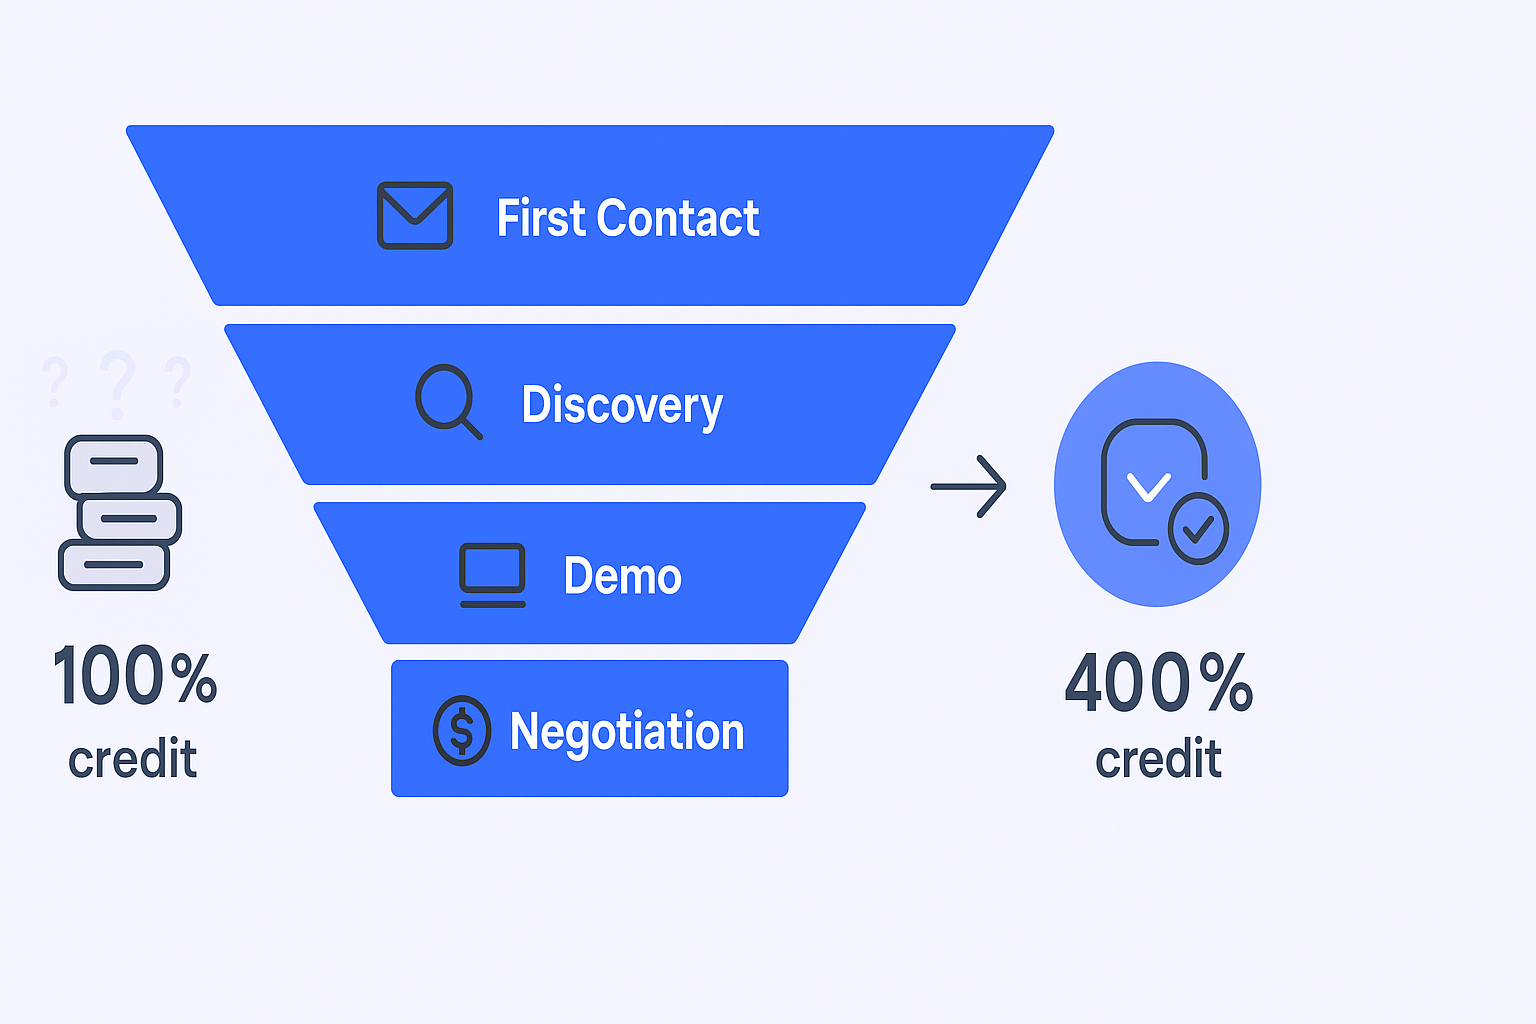
Here’s what matters: the pipeline tracks seller actions, not buyer feelings. It’s about what you need to do to move deals, not what’s happening in the prospect’s head. That’s actually a different thing called the sales funnel, which tracks the customer’s journey from awareness to purchase.

Why does this distinction matter? Because you control the pipeline. You decide which activities to track, which deals to prioritize, and which metrics tell you if you’re actually making progress toward your number.

The modern sales process demands precision. With 75% of B2B buyers preferring a rep-free experience, you can’t afford to waste time on the wrong activities or wrong deals. Every metric needs to tell you something actionable.

Sales Pipeline Metrics You Need to Track

Here are the metrics that actually move the needle, organized by where they matter most in your process.

Pipeline Generation Metrics

These numbers show if you’re creating enough opportunities—and whether they’re actually qualified.

📊 Data-Driven LinkedIn Outbound Campaigns

We target decision-makers, design conversion-focused sequences, and scale your qualified pipeline systematically

Activity Volume

This tracks your daily outreach: emails sent, calls made, LinkedIn messages, everything.

Benchmark? 30 prospects minimum on your worst day, with top performers hitting 100+ on good days.

But here’s the kicker: most sales reps spend only 2 hours per day actually selling. The rest? Administrative nonsense and fixing bad data. If you’re not tracking activity in your CRM, you’re flying blind—and probably spending way too much time on busywork instead of booking meetings.

Meetings Booked Per Month

This is your core output metric. How many qualified discovery calls did you actually schedule?

For outbound teams, you’re aiming for 5 to 25 meetings per month. Sounds like a wide range, but it depends on your market, offer, and data quality.

Speaking of data: cold email reply rates just hit 5.1%, which is brutal. If your contact info is garbage, you won’t hit these numbers no matter how good your pitch is. Quality data isn’t optional anymore.

Lead Response Time

This measures how fast you follow up when a lead raises their hand.

The stats here are wild: Companies that respond within one hour see a 53% conversion rate. Wait 24 hours? That drops to 17%.


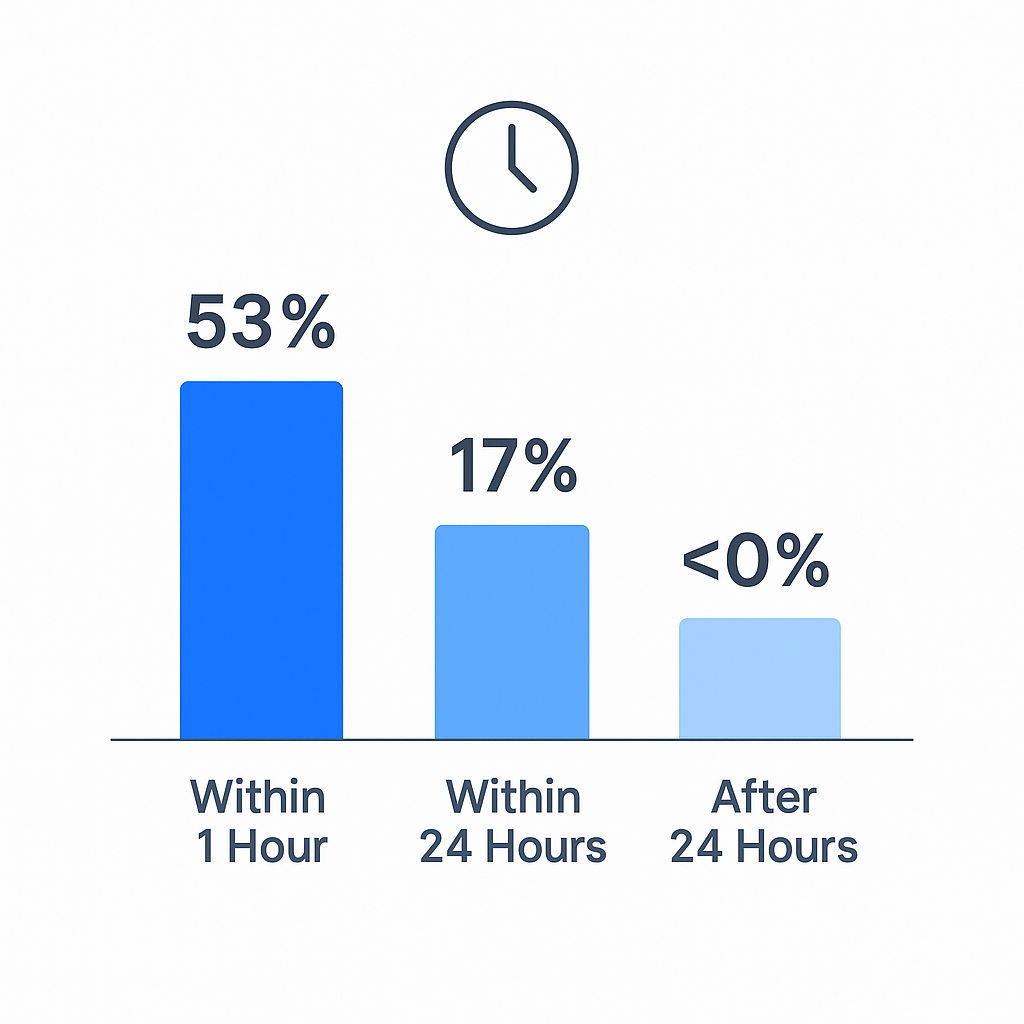
Think about that. Same lead, same offer, totally different outcome—just because you were slow. Speed wins.

âš¡ Instant LinkedIn Lead Engagement

Our outbound engine contacts high-intent prospects within minutes, maximizing your conversion window automatically

MQL to SQL Conversion Rate

This shows what percentage of Marketing Qualified Leads actually become Sales Qualified Leads that your team accepts.

Most B2B teams see 10-30% conversion, but high-performing SaaS companies push up to 40% in the enterprise space.

Low conversion here? That’s usually a sign marketing is targeting the wrong people, or your qualification criteria are misaligned. Fix this and suddenly your pipeline fills with real opportunities instead of time-wasters.

SQL Acceptance Rate

This is the percentage of qualified leads you actually accept into your active pipeline.

Top teams hit 59% acceptance for outbound leads. If yours is way lower, you’ve got a qualification problem—leads are being passed too early, before they’re truly ready.

Efficiency and Value Metrics

These numbers show how well you’re converting opportunities into closed revenue.

Sales Pipeline Velocity

This is arguably the single most important metric you can track.

It measures the dollar value your pipeline generates per day, calculated like this: (Number of Opportunities × Average Deal Size × Win Rate) ÷ Sales Cycle Length.

Teams that keep their sales cycle between 30-45 days achieve 38% higher velocity—averaging $2,134 per day—versus teams with longer cycles.

🚀 Accelerate Your Pipeline Velocity

LinkedIn targeting puts you in front of qualified buyers faster, shortening cycles and boosting daily revenue

This is straightforward: the average revenue of your closed deals.

Here’s the relationship that matters: smaller deals move faster, bigger deals take longer. Deals under $5,000 typically close in 30 days. Deals over $100,000? Expect 3-9 months because of all the stakeholders and budget approvals.

The key is knowing your number and factoring it into everything else you measure.

Sales Cycle Length

This measures days from first contact to closed-won (or lost).

The bad news: sales cycles have increased 32% since 2021. The good news: for mid-market deals up to $25K, 90 days is the benchmark you should be hitting.

If specific deals are taking way longer than average, that tells you exactly where to investigate. Is it stalling in Demo? Negotiation? Track duration by stage to find your bottlenecks.

Opportunity Win Rate

This is your percentage of qualified opportunities that actually close.

Average B2B win rate? About 21%. That’s it.

If you’re below that, you’ve got one of two problems: either leads aren’t truly qualified (fix your qualification process), or your pitch and negotiation skills need work (fix your closing process).

Deal Drop-Off Rate by Stage

Track what percentage of deals fall out at each specific stage.

Losing a ton after discovery? Your initial qualification is weak. High drop-off after demos? You’re not connecting the solution to their pain points well enough.

This metric tells you exactly where to focus your coaching and training efforts.

Health and Forecasting Metrics

These give you the 30,000-foot view leaders need to predict revenue and spot risks early.

Total Pipeline Value

Simple: add up the dollar value of every active opportunity.

You need this number to calculate your coverage ratio and build accurate forecasts.

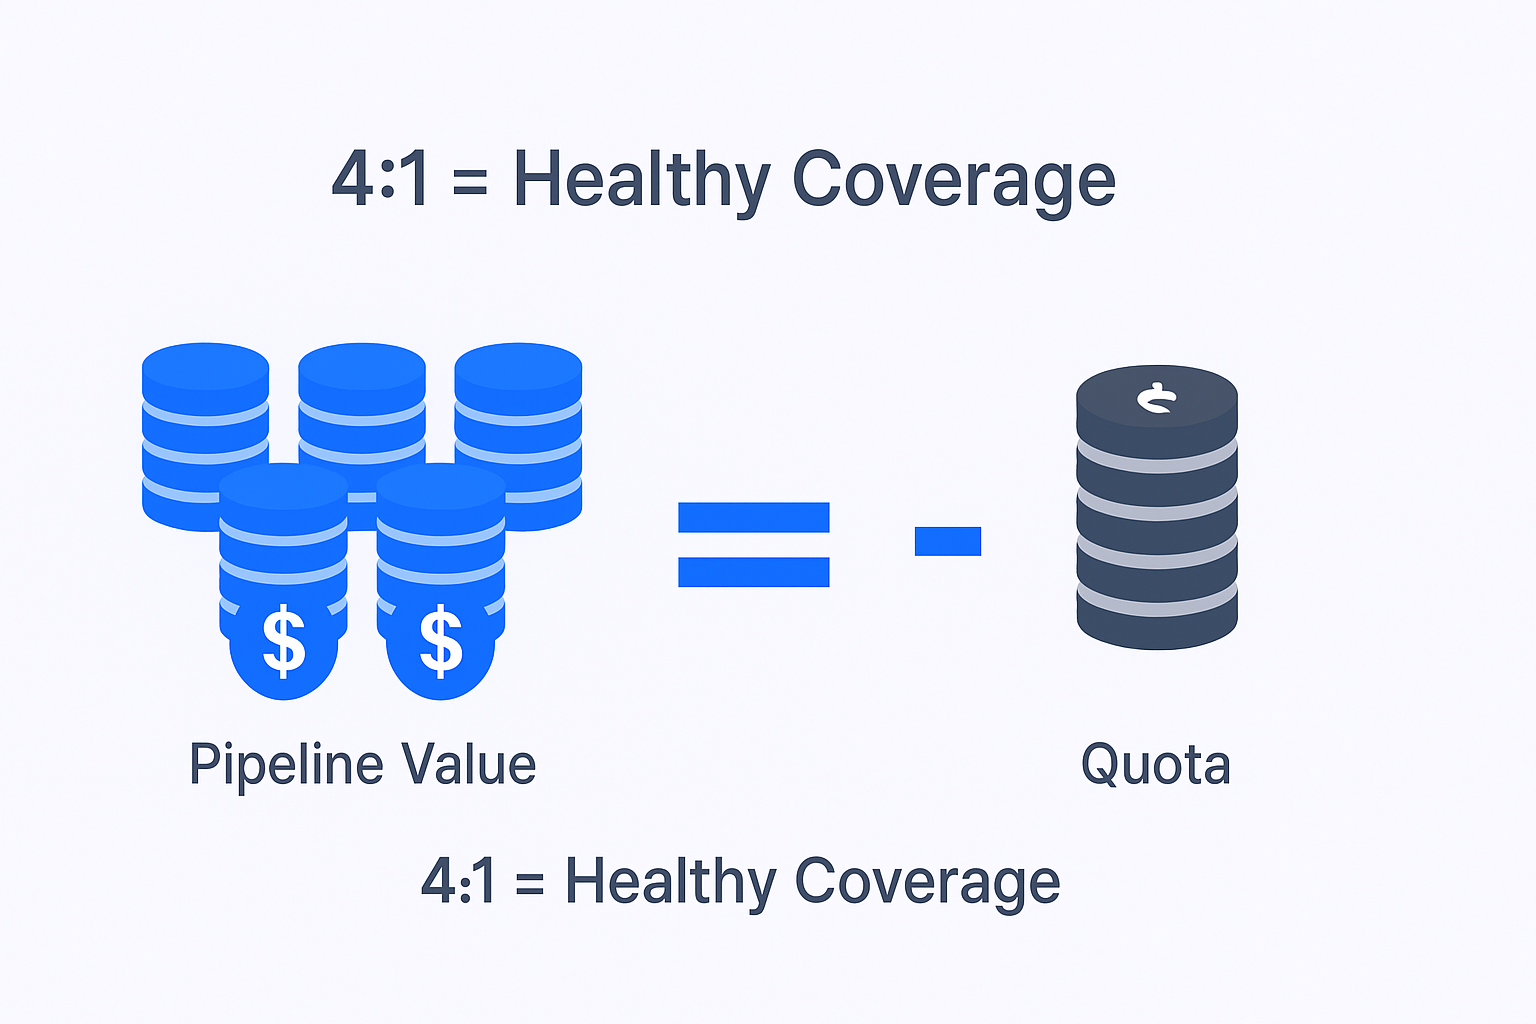
Pipeline Coverage Ratio

This is the ratio of your total pipeline value to your quota for the period.

Healthy teams maintain 3:1 to 4:1 coverage. Since the average win rate is only 21%, relying on 3:1 is risky for most teams. Aim for 4:1 to actually feel confident about hitting your number.


Stalled Deals

These are opportunities with no activity logged for 30+ days.

Stalled deals are poison. They inflate your pipeline value, distort your forecast, and hide the truth about your actual velocity and health. Clean them out ruthlessly.

Deal Loss Reasons

Track exactly why deals fall through: No Budget, Lost to Competitor, No Need, whatever.

This metric has two uses: First, if you’re losing deals because of “No Budget” or “No Need,” they should never have been qualified in the first place. Second, if you’re consistently losing to competitors, you need better positioning.

Data Quality Rate

This measures how accurate and complete your CRM data is.

Here’s the scary truth: 90% of customer databases are incomplete, and 20% of records are basically useless. Poor data quality costs businesses $700 billion annually.

For teams running outbound, bad data is a pipeline killer. You can’t hit conversion targets, response times, or win rates if your foundational contact info is decaying at rates up to 22% monthly in complex industries.

🎯 Verified LinkedIn Data First

Skip the data decay problem—our campaigns use LinkedIn's real-time profiles for accurate, qualified outreach daily

7-day Free Trial |No Credit Card Needed.

Text #5

How to Actually Use These Metrics to Crush Your Number

Stats are useless unless they drive action. Here’s what to do with all this data.

Fix Your Data Foundation First

Look at the numbers again: sales reps waste 21% of their day—basically a full workday every week—researching or correcting incomplete contact information.

The 1-10-100 Rule nails the financial impact: It costs $1 to verify data at entry, $10 to clean it later, and $100 if you do nothing (in lost deals, wasted time, and operational chaos).

Impact Category

Cost/Statistic

What It Means For You

Financial Drain

$700B lost annually

Budget bleeding everywhere

Wasted Time

21% of each day

Nearly a full day lost weekly

Data Decay

Up to 22% monthly

Your data goes stale fast

Deliverability Risk

25% of databases have critical errors

Your emails aren’t even landing

Action: Make data validation part of your process, not an IT project. Use automated tools to verify contact info—especially emails and phone numbers—at the point of entry. The ROI is immediate because your team can actually sell instead of playing detective.

Need help with this? Check out tools like Salesso, which provides verified email addresses and automates data validation so your team can focus on closing deals, not fixing records.

Accelerate Conversion Through Smart Engagement

Once your data is solid, focus on improving conversion rates through better timing and relevance.

Go Hyper-Targeted on Outbound

Stop blasting generic messages to giant lists. The data shows outbound sequences targeting 100 recipients or fewer get 5.5% reply rates versus way lower rates for bulk campaigns.

Run smaller, personalized campaigns using your verified data. Quality beats volume every time.

Master the Follow-Up

Persistence matters in B2B. It takes an average of 8 call attempts to reach a prospect, but most reps give up after 2-3.

Build persistence into your sequences and commit to multi-channel outreach. Break through the noise with systematic follow-up, not just hope.

Prioritize Speed

Remember that 53% conversion rate for leads followed up within an hour? Set up instant notifications for inbound leads and qualified opportunities.

If you wait until tomorrow, you’re willingly giving away revenue.

Optimize Your Cycle for Speed and Win Rate

Focus on maximizing pipeline velocity by shortening your sales cycle without killing deal size.

Ruthless Qualification

Apply qualification frameworks (MEDDIC, BANT, whatever works for you) to every single opportunity.

If a $2,000 deal is taking 90 days to close, it’s actively killing your velocity. Learn to quickly close or kill low-value, slow-moving opportunities that drain resources.

Automate the Admin

Since non-selling activities consume most of your day, automate everything you can. CRM automation can trigger follow-ups, alert you when deals stall, and log activities automatically.

Teams using automation see a 14% productivity increase. That’s more time in front of prospects, where it matters.

Key Sales Pipeline Benchmarks for 2025

Here’s your quick-reference guide for the metrics that matter most:

Metric

Benchmark

Why It Matters

Pipeline Coverage

3:1 to 4:1

Maintain 3-4x pipeline vs. quota for reliability

Average Win Rate

~21%

General B2B benchmark across all opportunities

MQL to SQL Rate

Up to 40% (SaaS)

High-performers convert way better at qualification

Lead Response Time

Within 1 hour

53% conversion within an hour vs. 17% after 24 hours

Sales Cycle Length

~90 days ($25K deals)

Benchmark for mid-market; larger deals take longer

Conclusion

Hitting your number in 2025 isn’t about working harder—it’s about measuring smarter.

The data is clear: every metric that defines your success—conversion rates, pipeline velocity, win rates—is undermined by inefficient processes and poor data quality.

If your team is spending a full day every week fixing bad contacts, then every dollar you invest in training, technology, or headcount is structurally capped.

The most powerful move you can make today: Audit your prospecting lists. Make sure your contact data is verified and current. Everything else—your outreach, your timing, your close rate—depends on that foundation.

Your pipeline engine only runs as well as the fuel you put into it. Clean data means your emails land, your time is protected, and your deals close faster.

Want verified contact data that actually works? Try Salesso to build a sales pipeline that converts instead of one that just looks busy.


Master Your Sales Pipeline Data

LinkedIn outbound delivers qualified SQLs while you optimize conversion rates and velocity

Segmentation That Actually Converts

LinkedIn outbound targets precise demographics with strategic campaign design and scaling methods