- blog
- Statistics
- Win Rate Statistics: 2024 Benchmarks & Top Performer Secrets

Table of Contents
Win Rate Statistics
- RAIN Group reports average win rate at 47%, while HubSpot reports 21%, showing massive variation in how opportunities are defined
- Average B2B win rate for deals under $10K is 31.3%, dropping significantly as deal sizes increase
- Deals $100K+ average only 18.7% win rate due to more stakeholders, longer timelines, and increased scrutiny
- Referrals achieve 40-60% win rates, significantly higher than other lead sources due to built-in trust
- Inbound leads convert at 30-50% win rates, while outbound leads only achieve 10-25% success rates
- Short sales cycles (<30 days) achieve 30-40% win rates, while long cycles (>3 months) drop to 10-20%
- Elite performers (top 7%) achieve 75% win rate, while the bottom 80% average only 40% win rate
- Deals are 58% more likely to close when 4+ contacts are involved in the sales process
- Deals are 233% less likely to close without engaging a key decision-maker in the organization
- 10% higher win rate when pricing is discussed on the first call rather than avoided or delayed
- 49% better chance of closing when competition is addressed early in the sales conversation
- Improving win rate by just 5 percentage points can create a 25% revenue increase from the same pipeline
- With a 21% average win rate, 79% of sales time generates zero return, highlighting massive inefficiency
- Forecast accuracy formula is Pipeline Value × Win Rate, enabling precise revenue predictions over time
- Multi-threading accounts by engaging multiple stakeholders is a critical strategy that separates elite performers from average reps
You just closed a big deal. The high is real. The commission check is already spent in your head.
Then you look at your pipeline and reality hits. Three deals you were sure about have gone cold. One ghosted you. Another went with a competitor. The third is “still thinking about it” (translation: dead).
You end the quarter with a 25% win rate. Is that good? Bad? Average?
Most sales pros have no idea. They track calls, emails, and meetings. But they’re flying blind on the one metric that actually matters: how often they win when it counts.
Here’s the truth: win rate is your report card. It’s the clearest measure of whether you’re effective at closing or just spinning your wheels.
This guide gives you the definitive benchmarks, shows what separates the 75% closers from the 21% average, and reveals the specific behaviors that make the difference.
Defining Sales Win Rate
Before we dive into numbers, we need to get crystal clear on what we’re measuring. Because here’s the thing: most teams calculate win rate wrong.
At its core, win rate is the percentage of opportunities you turn into closed-won deals. Simple enough, right?
Wrong. The confusion comes from what counts as an “opportunity.”
The Denominator Problem (Most People Get This Wrong)
There are two ways people calculate win rate, and they measure completely different things:
Formula 1: The True Win Rate
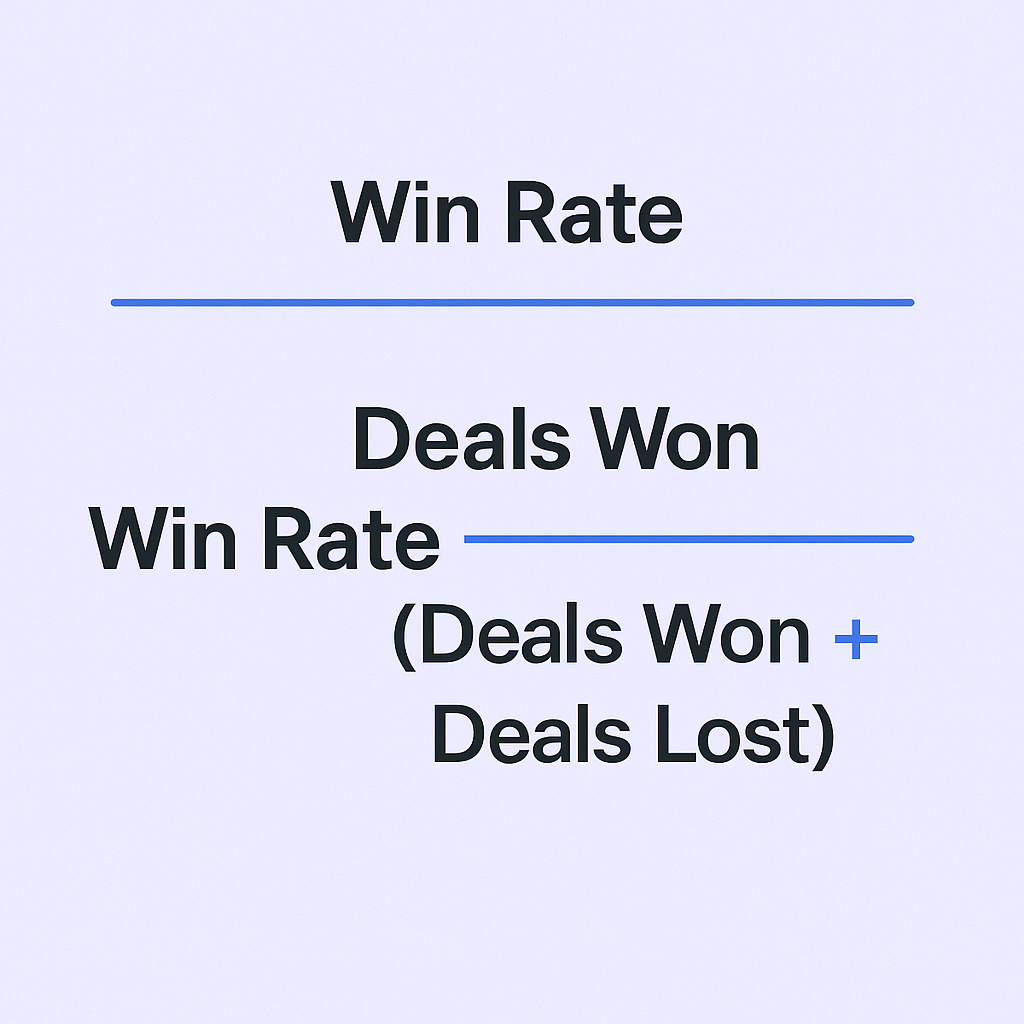
Win Rate = Deals Won / (Deals Won + Deals Lost)
This formula focuses only on deals that reached a final decision. It answers: “When someone makes a choice, how often do they choose us?”kz

This is what analytics firms like Gong use. It’s the real measure of your closing effectiveness.
Formula 2: The Funnel Conversion Rate
Win Rate = Deals Won / Total Opportunities
This includes deals still open or disqualified. It’s actually measuring your entire funnel efficiency, not just closing ability.
Which one matters? Both. But know which one your leadership cares about because it tells you where to focus.
Win Rate vs. Close Rate: Not the Same Thing
People use these terms interchangeably. They shouldn’t.
Metric | What It Measures | Formula | Best For |
Win Rate | Success when deals reach final decision | Deals Won / (Won + Lost) | Competitive effectiveness |
Close Rate | Overall funnel conversion | Deals Closed / Total Leads | Pipeline efficiency |
Win rate is your batting average when the game is on the line. Close rate measures how many prospects even stepped up to bat.
———————————————————————————————————-
H1: 📊 Target High-Intent Decision-Makers
H2: LinkedIn outbound puts you in front of qualified prospects who actually have budget and authority
CTA: Book Strategy Meeting
———————————————————————————————————-
Average Win Rates: The Benchmarks You Need
So what’s a good win rate? The answer depends on who you ask.
RAIN Group says the average is 47%. HubSpot reports 21%. That’s a massive gap.
Here’s why: it’s the denominator problem again. HubSpot includes every opportunity that enters the pipeline. RAIN Group focuses on qualified deals that reach proposal stage.
The lesson? When someone throws out a win rate stat, first question is always: “How are you defining an opportunity?”
Let’s break down the real benchmarks that matter.
Win Rates by Deal Size
Not all deals are equal. A $5K SMB deal and a $500K enterprise deal live in different universes.
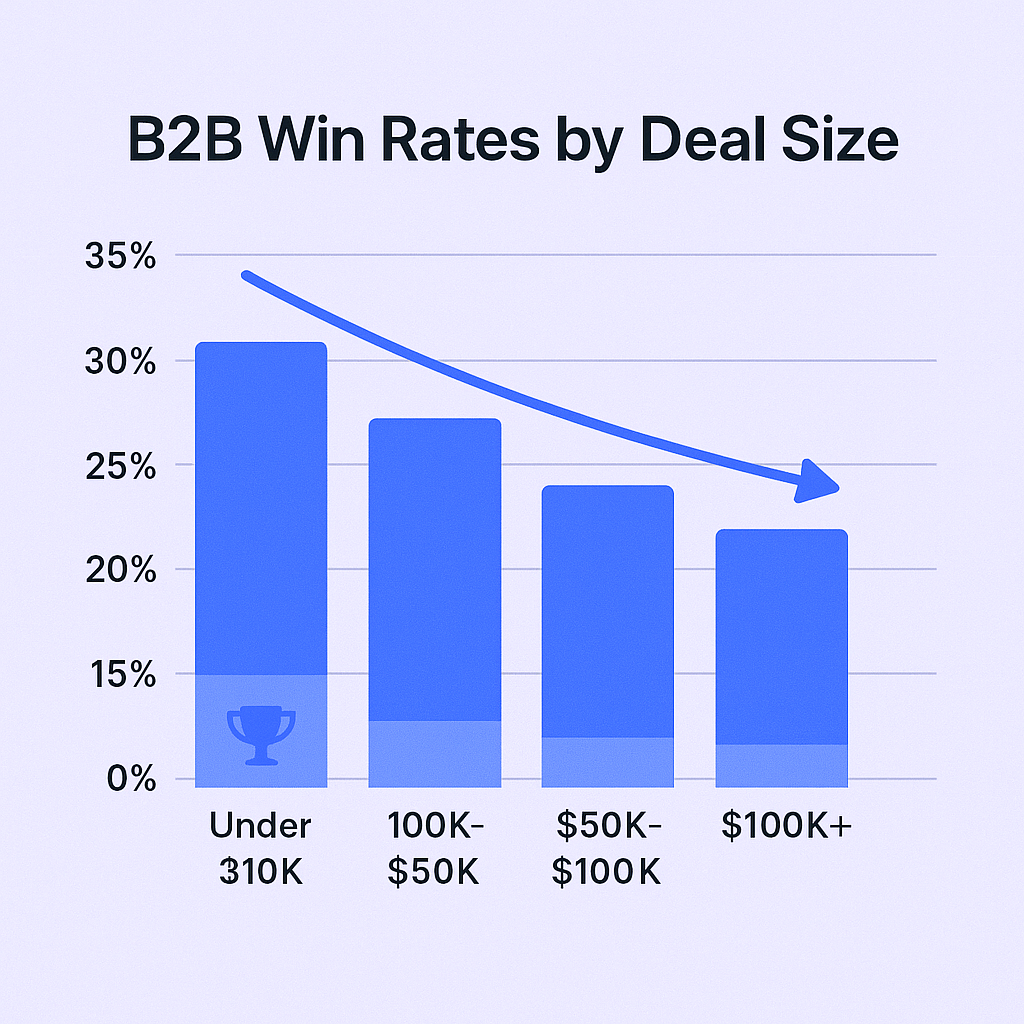
Average B2B Win Rates by Deal Size:
- Under $10K: 31.3%
- $10K–$50K: 24.0%
- $50K–$100K: 19.6%
- $100K+: 18.7%
The pattern is clear: bigger deals = lower win rates. More stakeholders, longer timelines, more scrutiny. It’s the price of playing in the enterprise game.

If you’re closing $100K+ deals at 25%, you’re crushing it. If you’re closing $5K deals at 25%, you’ve got work to do.
Win Rates by Lead Source
Where your lead comes from matters. A lot.
Average B2B Win Rates by Source:
- Referrals: 40-60%
- Inbound Leads: 30-50%
- Outbound Leads: 10-25%
🎯 Smart Outbound Wins More Deals
Our LinkedIn targeting system identifies warm prospects before competitors even know they exist
Referrals carry built-in trust. Inbound leads already know you exist. Outbound? You’re starting from scratch.
If your pipeline is 80% outbound, expecting a 40% win rate is delusional. Know your mix, set realistic expectations.
Win Rates by Sales Cycle Length
Time kills deals. The data proves it.
Average B2B Win Rates by Cycle:
- Short (<30 days): 30-40%
- Medium (1-3 months): 20-30%
- Long (>3 months): 10-20%
A deal stuck in your pipeline for 90+ days? It’s probably dead. Either build momentum fast or qualify it out.
Win Rates by Performance Group: The Elite vs. Everyone Else
Average benchmarks are fine. But if you’re ambitious, you want to know what it takes to be elite.
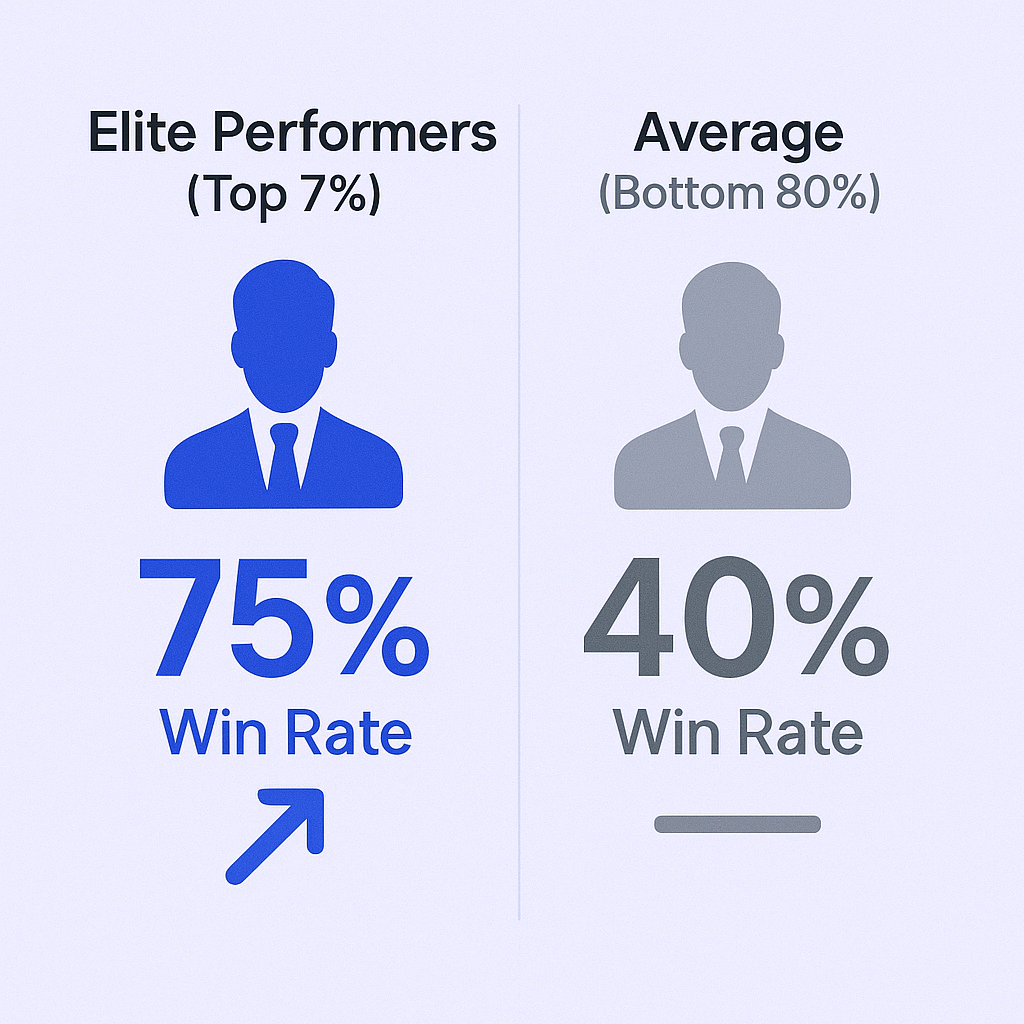
The data reveals a stunning gap:
Elite Performers (top 7%): 75% win rate
The Rest (bottom 80%): 40% win rate
That’s not a small difference. That’s the gap between crushing quota every quarter and barely scraping by.

Here’s what separates them.
What Elite Performers Do Differently
Top performers aren’t lucky. They’re not naturally gifted. They follow specific, repeatable behaviors.
The common thread? Proactivity. They control the sales process instead of reacting to it.
They’re Ruthless Qualifiers
Average reps try to sell to everyone. Elite reps understand their time is their most valuable asset.
A low win rate often means a bloated pipeline. Too many deals that were never real. Too much time wasted on people who’ll never buy.
Top performers ask the tough questions early. Budget. Authority. Timeline. They’d rather lose fast than lose slow.
They Multi-Thread Like Crazy
Average reps rely on a single champion. When that person leaves or loses influence, the deal dies.
Elite performers build relationships across the org. The data from Gong is stunning:
- Deals are 58% more likely to close when 4+ contacts are involved
- Deals are 233% less likely to close without a key decision-maker
🔗 Multi-Thread Accounts on LinkedIn
Our campaign design systematically engages multiple stakeholders to accelerate your sales cycle
Map the org. Talk to the end user, the champion, the CFO. Build a web, not a single thread.
They Discuss Competition and Pricing Early
Most reps avoid talking about competitors or price. They think it’ll scare prospects away.
Elite performers do the opposite. They lean into the tough conversations.
The numbers back it up:
- 10% higher win rate when pricing is discussed on the first call
- 49% better chance of closing when competition is addressed early
Ask: “What other solutions are you looking at?” Frame the competitive narrative before someone else does.
Impact of Win Rate on Revenue
Improving win rate isn’t about bragging rights. It’s about money in your pocket.
The Win Rate Multiplier Effect
Small improvements create exponential results.
Example:
You have a $500K pipeline with a 20% win rate.
Forecast: $100K
Improve your win rate by just 5 points to 25%.
New forecast: $125K
That’s a 25% revenue increase from a 5-point improvement.
💰 Scale Your Pipeline Intelligently
LinkedIn outbound fills your pipeline with qualified opportunities that actually convert into revenue
Less pressure to constantly chase new deals. More time focusing on quality opportunities.
The Hidden Costs of a Low Win Rate
With a 21% average win rate, 79% of your time generates zero return. Think about that.
Nearly 8 out of 10 deals you work on will fail.
The damage compounds:
- Wasted time and effort on deals that go nowhere
- Higher stress and burnout from maintaining massive pipelines
- Lower commissions because every lost deal is a check you never write
Win Rate for Sales Forecasting
Want to predict your performance? Use this formula:
Forecast = Pipeline Value × Win Rate
Track your personal win rate over time. You’ll develop a crystal-clear forecasting model. No more guessing. No more surprises.
Conclusion: From Average to Elite
Win rate isn’t just a metric. It’s a compass.
It shows you where you are and points you where you need to go.
Key takeaways:
- Calculate correctly: Focus on deals that reached final decision for true closing effectiveness
- Benchmark intelligently: Compare yourself against similar deal sizes, sources, and cycles
- The gap between average and elite is strategy, not talent: Master qualification, multi-threading, and proactive conversations
Your next steps:
- Calculate your personal win rate for last quarter: Deals Won / (Deals Won + Deals Lost)
- Commit to ONE elite strategy for the next 30 days: qualification, multi-threading, or early objection handling
The foundation of every winning strategy? A pipeline filled with the right people at the right companies.
Elite performers don’t waste time on bad data. They build high-quality pipelines with verified contact information that lets them focus on what they do best: winning.
Want to improve your email deliverability and reach the right prospects? Start with quality data. That’s where Salesso comes in.
🚀 Advanced LinkedIn Targeting
Strategic demographic segmentation delivers personalized campaigns with systematic scaling approaches
7-day Free Trial |No Credit Card Needed.

Boost Your Win Rate with LinkedIn
Target decision-makers directly and close more deals with proven LinkedIn outreach campaigns
Segmentation That Actually Converts
LinkedIn outbound targets precise demographics with strategic campaign design and scaling methods

