- blog
- Sales Engagement
- Average Deal Size Statistics: 2025 Sales Benchmarks & Data
Table of Contents
Average Deal Size Statistics
- 81% of revenue leaders say their team’s deals are more complex than ever before in 2025
- Median B2B deal size across all industries is $4,000, serving as a baseline benchmark for sales teams
- B2B SaaS companies average $26,265 in Annual Contract Value (ACV), significantly higher than general B2B
- Bootstrapped companies have $23,391 median ACV, while equity-backed companies achieve $35,761 median ACV
- Companies with 100-110% Net Revenue Retention achieve $44,073 median ACV, more than double those below 90% NRR
- Deals $1,000-$5,000 close in 40 days, while deals $50,000-$100,000 take an average of 120 days
- Mid-market deals between $50K-$100K now take an average of nine months to close, 45 days longer than smaller deals
- Inbound leads are 62% more cost-effective, but outbound campaigns generate 50% larger deal sizes on average
- Outbound leads convert at a 34% higher rate than inbound when executed properly with strategic targeting
- Upselling and cross-selling each contribute an average of 21% to total company revenue, making them critical strategies
- Excessive discounting can reduce customer lifetime value by as much as 30%, harming long-term revenue
- Multi-threading by building relationships with multiple stakeholders boosts win rates by 130% in deals over $50,000
- Moving customers from monthly to annual contracts immediately increases Total Contract Value and commission earnings
- Products advertised with AR/VR content see a 94% higher conversion rate than products without immersive experiences
- Strategic outbound integration achieves twice the revenue growth of inbound-only organizations across B2B companies
Let’s be honest—some quarters, everything clicks. Deals close left and right, and your commission check makes you smile. Other times? It feels like you’re swimming upstream, and quota stays just out of reach.
Here’s the thing: relying on gut feelings to predict your sales performance is stressful. What if there was a simple metric that could help you work smarter, close bigger deals, and actually hit your targets with less chaos?
Enter: Average Deal Size.
This isn’t just another number for your manager’s dashboard. It’s your personal roadmap to higher earnings, better forecasting, and a more strategic approach to selling. In this guide, we’ll walk you through the statistics that matter, real benchmarks from 2025, and concrete ways to increase the value of every deal you close.
What is Average Deal Size?
Average Deal Size (sometimes called Average Contract Value or ACV) measures the typical monetary value of your closed-won deals over a specific period—usually monthly or quarterly.
Think of it as your quality scoreboard. While other metrics track how many deals you close, this one shows how valuable those wins actually are.
The Simple Formula
Calculating your average deal size is straightforward:
Average Deal Size = Total Revenue from Closed Deals Ă· Number of Closed Deals
Â

Â
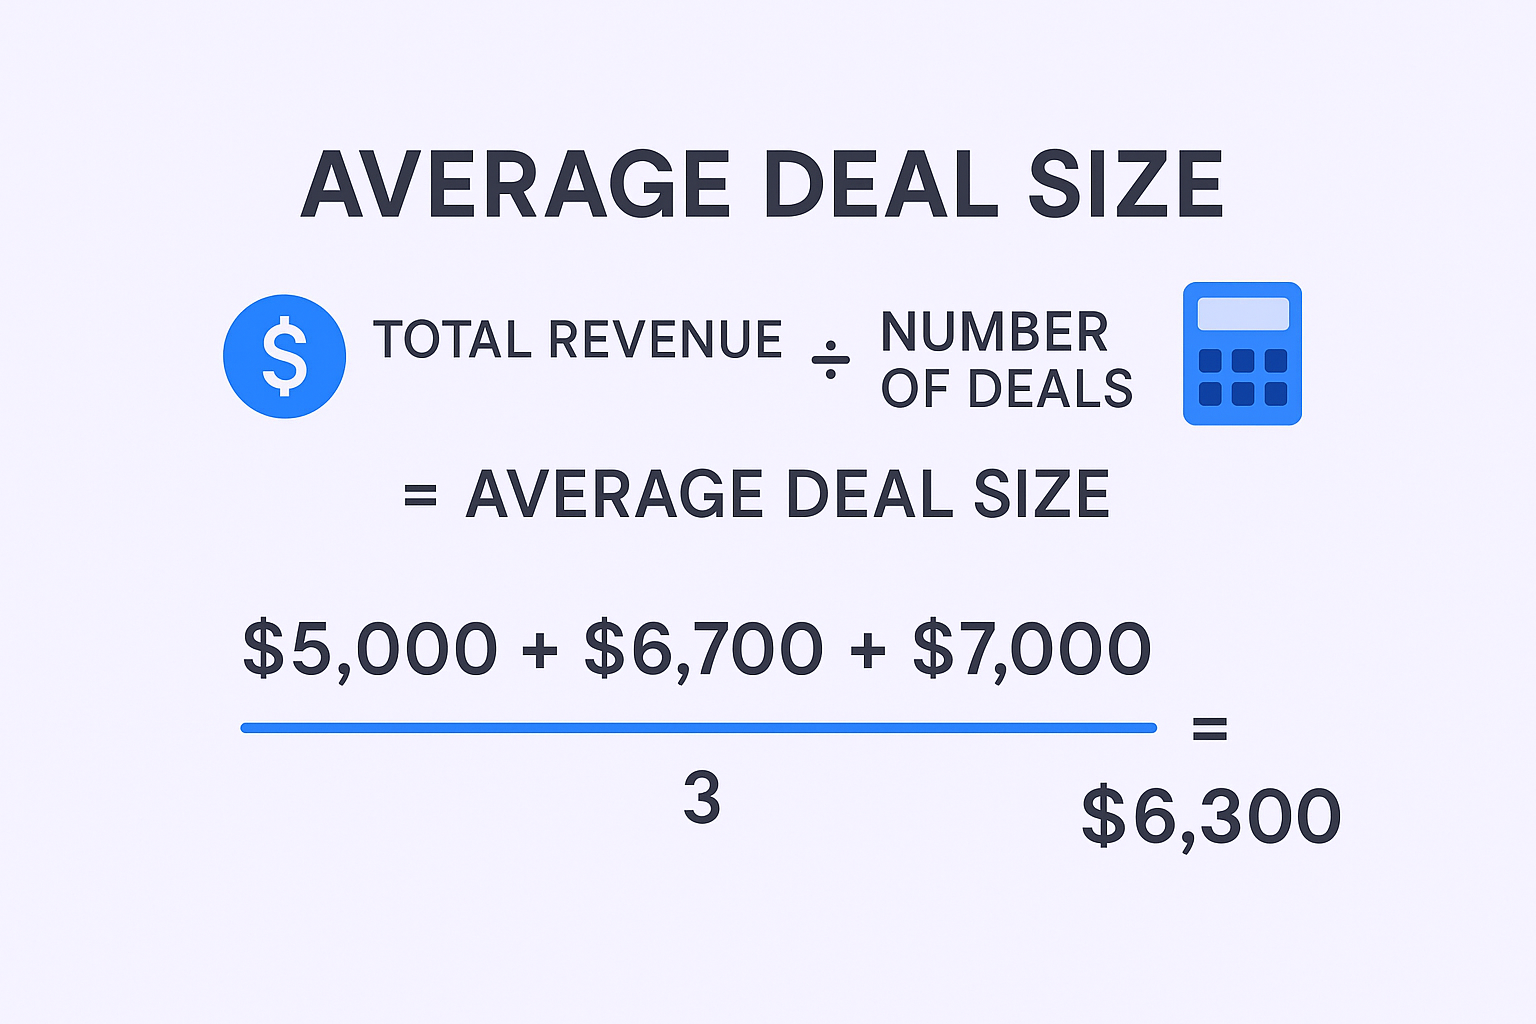
Here’s a quick example: Say you close three deals in a quarter worth $5,000, $6,700, and $7,000. Your total revenue is $18,900. Divide that by three deals, and your average deal size is $6,300.
That’s it. No complex math required.
Why Average Deal Size Statistics Matter for Your Sales Strategy
Most sales teams obsess over activity metrics—more calls, more emails, more touches. While activity matters, this approach often leads to burnout without proportional results.
Focusing on deal size flips the script. Instead of closing 20 small deals to hit quota, what if you could close 10 larger ones? Same revenue target, half the effort, and way less stress.
Here’s why this metric deserves your attention:
Higher earnings, fewer deals. Many commission structures include accelerators—your rate increases after hitting certain thresholds. One $100,000 deal can be significantly more lucrative than four $25,000 deals. You’re not just working smarter; you’re earning more per closed deal.
Career advancement fuel. Consistently closing deals above your team’s average is concrete proof you can handle complex sales cycles and deliver strategic value. It’s the kind of evidence that gets you promoted to senior or enterprise roles.
Forecasting with confidence. When you know your personal average, you can predict your income and quota attainment with real data instead of hope. No more end-of-quarter panic.
The bottom line? Tracking and improving your average deal size isn’t optional if you want to thrive in modern sales—it’s essential.
Average Deal Size Statistics: 2025 Benchmarks
Let’s cut through the noise and look at real numbers. What does “good” actually look like in 2025?
The Big Picture: B2B Sales Climate Right Now
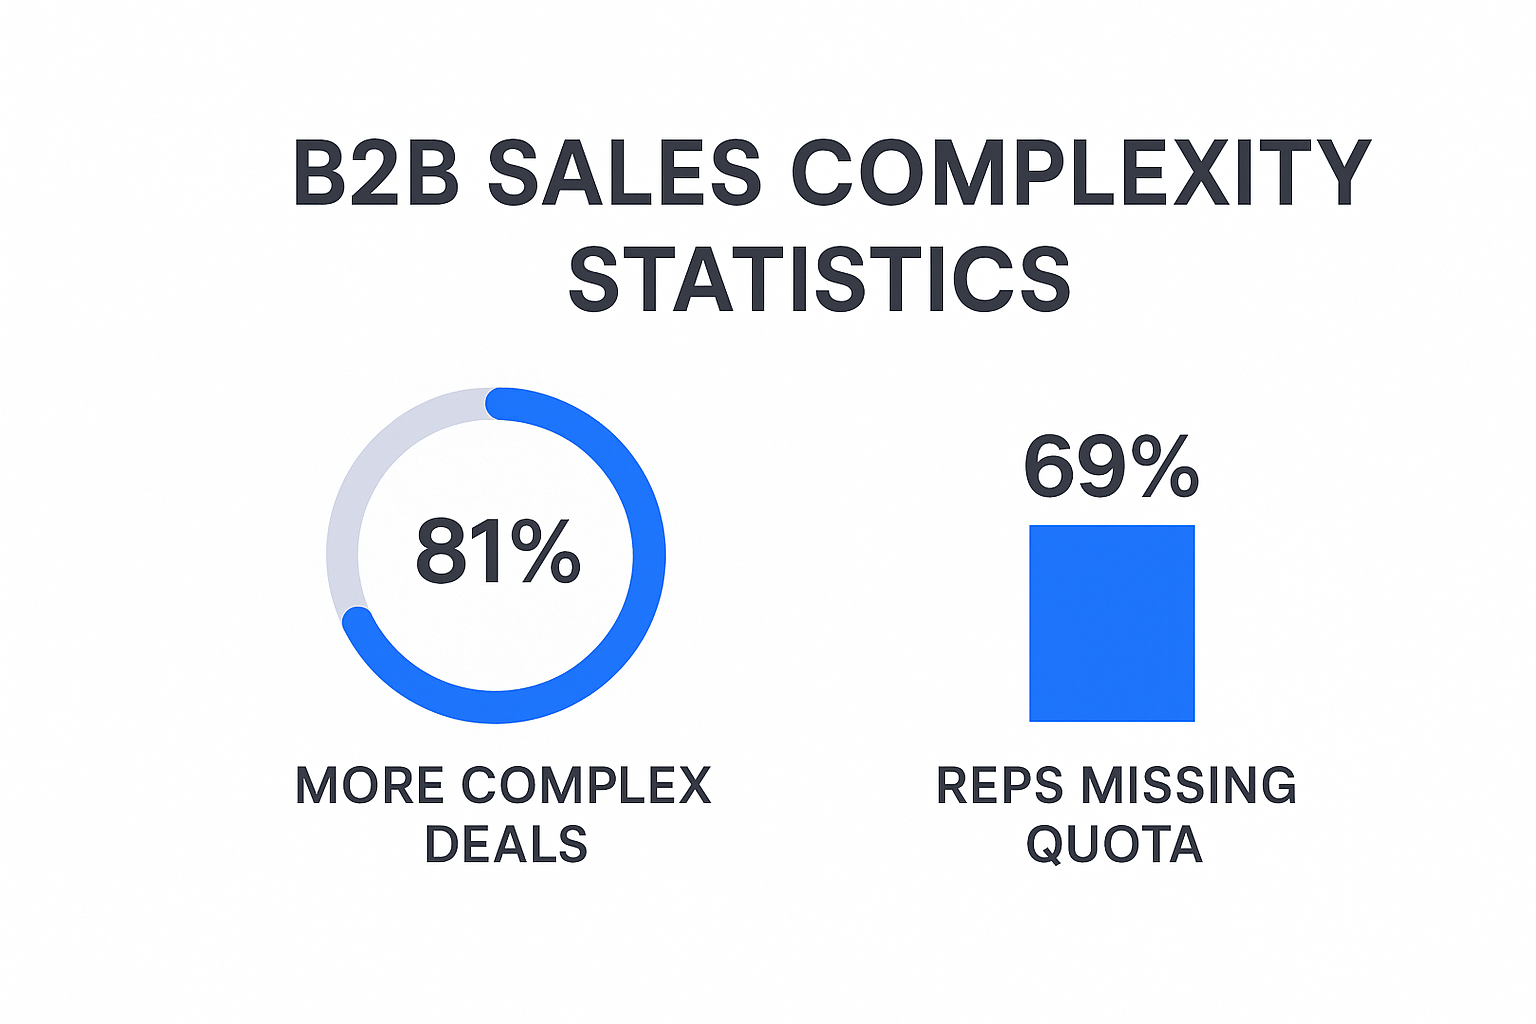
The current landscape is challenging. According to Gong’s 2024 report, 81% of revenue leaders say their team’s deals are more complex than ever before. Buyers are more cautious, buying committees are larger, and sales cycles are stretching longer.
Â

Â
Â
Notice the jump? As companies mature and target larger organizations, their average deal size more than doubles.
By Funding Model
- Bootstrapped companies: $23,391 median ACV
- Equity-backed companies: $35,761 median ACV
Venture-backed companies typically prioritize growth and target larger deals, while bootstrapped businesses often focus on profitability through volume.
By Customer Health (Net Revenue Retention)
- Companies with 100-110% NRR: $44,073 median ACV
- Companies with below 90% NRR: $21,017 median ACV
This correlation makes sense—products that deliver massive value and enable customer growth command higher price points from day one.
Deal Size and Sales Cycle: The Time-Value Connection
Here’s a reality check: bigger deals take longer to close. Understanding this relationship helps you forecast accurately and manage your pipeline strategically.
Average Sales Cycle by Deal Size:
- $1,000-$5,000 deals: 40 days
- $5,000-$10,000 deals: 55 days
- $10,000-$50,000 deals: 75 days
- $50,000-$100,000 deals: 120 days
According to Norwest’s benchmark report, mid-market deals between $50K and $100K now take an average of nine months to close. That’s 45 days longer than deals in the $10K-$50K range.
Plan accordingly. That enterprise deal might be worth waiting for, but you’ll need smaller wins to fill the gap while it moves through the pipeline.
What You Need to Know Before Calculating
Before you crunch numbers, consider these factors to ensure your calculation is meaningful:
Pick your timeframe. Most teams calculate monthly or quarterly. Quarterly gives you a more stable average that smooths out anomalous months. Monthly helps you spot trends faster.
Include only closed-won deals. Don’t count prospects, pending deals, or anything that hasn’t actually generated revenue. This metric measures real performance, not potential.
Track consistently. Calculate at the same intervals using the same criteria. Consistency lets you spot trends, compare performance periods, and measure improvement over time.
How to Calculate Average Deal Size
Let’s walk through this step by step.
Step 1: Choose your time period (let’s say Q1 2025)
Step 2: Add up the total value of all deals you closed in that period
- Deal 1: $8,000
- Deal 2: $12,500
- Deal 3: $6,800
- Deal 4: $15,200
- Total: $42,500
Step 3: Count how many deals you closed
- Total deals: 4
Step 4: Divide total revenue by number of deals
- $42,500 Ă· 4 = $10,625
Your average deal size for Q1 is $10,625. Now you have a baseline to improve from.
Key Factors That Impact Your Deal Size
Not all deals are created equal, and understanding what drives size variations helps you maximize every opportunity.
Lead Source: The Inbound vs Outbound Surprise
Here’s where conventional wisdom gets challenged. Most people assume inbound leads—prospects who come to you—are superior because they’re “warm” and already interested.
While inbound leads do convert at higher rates (they’re often 62% more cost-effective), here’s the counterintuitive truth: outbound prospecting consistently generates larger deals.
The statistics tell the story:
- Outbound campaigns generate 50% larger deal sizes on average compared to inbound (ITSMA study)
- Companies integrating strategic outbound achieve twice the revenue growth of inbound-only organizations (DemandGen B2B Buyer Behavior Study)
- When executed properly, outbound leads convert at a 34% higher rate than inbound (Forbes)
Why the difference? Inbound is reactive; outbound is proactive.
With inbound, prospects self-diagnose their problem and define their own scope—usually smaller than what’s actually possible. Your sales conversation is constrained by their limited understanding.
With outbound, you initiate and frame the conversation. You can elevate a tactical pain point into a strategic business challenge that impacts the entire organization. You’re not reacting to their problem scope—you’re defining a larger, more valuable problem worth solving.
 💼 LinkedIn Outbound Drives Bigger Deals
Stop waiting for leads. We’ll build campaigns that reach decision-makers at your ideal deal size companies
The implication? If you want to consistently close bigger deals, you can’t rely solely on inbound. You need a targeted outbound strategy.
Product Complexity and Market Position
The more sophisticated your solution, the higher price point you can justify. Enterprise-grade features, advanced integrations, and comprehensive support naturally command premium pricing.
Similarly, your target market matters enormously. Selling to Fortune 500 companies opens budgets that small businesses simply don’t have. A 10-person startup has different spending capacity than a 1,000-person enterprise.
The Sales Cycle Reality
As we covered in the benchmarks, larger deals require more time. Multiple stakeholders need convincing, procurement processes kick in, and legal reviews happen. A $100K deal involving six decision-makers will naturally take longer than a $5K one-person purchase.
Understanding this relationship helps you build realistic pipelines and avoid the trap of expecting quick closes on high-value opportunities.
How Companies Use Average Deal Size as a Sales Performance KPI
Smart sales organizations don’t just calculate this metric—they actively use it to drive strategy.
Revenue Forecasting When you know your average deal size and typical close rate, predicting quarterly revenue becomes straightforward math instead of guesswork. Multiply your pipeline by historical percentages, and you’ll get reliable forecasts.
Pipeline Health Assessment If your average starts declining, it’s an early warning sign. Maybe you’re attracting smaller prospects, or perhaps your team is discounting too aggressively. Either way, the metric helps you diagnose problems before they crater your revenue.
Performance Benchmarking Comparing individual reps’ averages reveals who’s mastering value-based selling versus who’s defaulting to discounting. This insight drives coaching priorities and identifies promotion candidates.
Resource Allocation Understanding which market segments or product lines drive higher deal values helps you allocate sales resources strategically. Double down on what’s working; adjust what isn’t.
Commission Optimization Many companies structure commissions to reward larger deals with accelerators or bonuses. When reps understand their average and see how bigger deals exponentially increase earnings, behavior shifts fast.
Proven Strategies to Increase Your Average Deal Size
Enough theory. Let’s talk tactics you can implement immediately to start closing larger deals.
Qualify for Value, Not Just Interest
Stop chasing every lead that shows a pulse. If your target average is $50,000, spending weeks on a prospect with a $5,000 budget is inefficient.
🎯 Target High-Value Prospects First
Our LinkedIn outbound system connects you directly with CFOs and VPs who control six-figure budgets
Use firmographic data—company size, revenue, employee count, industry—to ruthlessly prioritize accounts that match your ideal deal profile. A qualified lead isn’t just interested; they have the capacity and need for a substantial investment.
Lead with Value Propositions
Don’t lead with product features. Lead with the expensive problem you solve.
During discovery, dig deep into their pain points and quantify the cost. How much time are they wasting? How much revenue are they losing? What’s the dollar impact of their inefficiency?
A well-defined $50,000 problem justifies a $50,000 solution. Frame conversations around business outcomes, not software capabilities.
Master Upselling and Cross-Selling
The easiest path to bigger deals? Sell more to the same buyer.
HubSpot data shows that upselling and cross-selling each contribute an average of 21% to total company revenue. That’s not marginal—it’s massive.
Upselling means selling a premium tier or more advanced version of what they’re considering. Cross-selling means adding complementary products or expanding the solution to other departments.
The key? Tie these additions directly to specific pain points uncovered in discovery. Position them as completing the solution, not adding cost.
Build Strategic Tiers and Bundles
Instead of one monolithic offering, package solutions into Good-Better-Best tiers.
This accomplishes two things: it creates a natural upsell path, and it anchors pricing higher by presenting multiple options. When prospects see three price points, their decision often shifts from “Should we buy?” to “Which version should we buy?”
Frame higher tiers as solving bigger business challenges with greater ROI.
Avoid the Discount Trap
Discounting feels like an easy way to close deals faster. It’s also one of the most destructive habits in sales.
Research from Price Intelligently shows excessive discounting can reduce customer lifetime value by as much as 30%. You’re not just shrinking one deal—you’re training customers to expect discounts forever.
When faced with pricing objections, pivot back to value. Try this tactical response: “That’s an interesting question. To reach that price point, which components would you be willing to remove?”
This reinforces that price equals value. Alternatively, offer value-adds like premium onboarding or dedicated support instead of monetary discounts.
Multi-Thread Your Deals
In B2B sales, there’s rarely one decision-maker. Ignoring the buying committee is a critical mistake.
According to Gong’s research, multi-threading—building relationships with multiple stakeholders—boosts win rates by 130% in deals over $50,000.
đź”— Multi-Thread Your LinkedIn Campaigns
Our outbound strategy maps buying committees and engages all stakeholders who influence seven-figure purchases
Connect with the economic buyer (controls budget), technical buyer (evaluates the solution), and end-users (interact daily). Each stakeholder reveals different problems and priorities, helping you build a comprehensive business case that justifies a larger investment.
Broad organizational support unlocks bigger budgets and secures the win.
Sell Longer Contract Terms
A simple but effective tactic: focus on contract length, not just deal size.
Moving customers from monthly to annual or multi-year contracts immediately increases Total Contract Value. This is often directly tied to commission and quota attainment.
Incentivize longer commitments with strategic discounts—”pay for 10 months, get 12.” The customer gets cost certainty and a small savings; you get a larger, more stable revenue stream.
Leverage Better Lead Data for Smarter Targeting
Here’s a truth many sales teams discover too late: you can’t close big deals if you’re talking to the wrong people.
🚀 Precision Targeting on LinkedIn
We identify and engage enterprise buyers whose average deal size matches your revenue goals exactly
7-day Free Trial |No Credit Card Needed.
Finding decision-makers at companies that match your ideal deal size profile is foundational to everything else. You need accurate contact data, verified email addresses, and direct access to the stakeholders who control budgets large enough to match your targets.
That’s exactly where Salesso comes in.
Salesso provides verified cold email addresses that help you connect directly with high-value prospects—the CFOs, VPs, and executives at mid-market and enterprise companies who have the authority and budget for substantial investments.
Instead of wasting time on dead-end leads or bounced emails, you’re reaching the right people at the right companies from day one. Better targeting means bigger opportunities. Bigger opportunities mean higher average deal sizes.
When you’re prospecting accounts in the $50K+ range, precision matters. Salesso gives you that precision.
Conclusion
Average deal size isn’t just a metric—it’s a lens that transforms how you approach sales.
The statistics are clear: the median B2B deal is $4,000, B2B SaaS companies average $26,265 in ACV, and outbound prospecting generates 50% larger deals than inbound alone. Companies with strong customer retention see double the deal sizes of those struggling with churn.
More importantly, you now know the specific strategies that move the needle: qualifying ruthlessly for value, leading with quantified pain points, mastering upsells, avoiding discount traps, multi-threading every major deal, and targeting the right accounts with precision.
The path to bigger deals starts with better data and smarter targeting. When you’re reaching decision-makers who match your ideal customer profile, every conversation has the potential to be your biggest win yet.
Calculate your current average. Set a goal 20% higher. Then implement one strategy from this guide this week.
Your next big deal is out there. Go close it.
FAQs
What's considered a good average deal size?
How often should I calculate my average deal size?
What's the difference between ACV and average deal size?
How do I increase my average without losing customers?
Does industry significantly affect average deal size?
Close Bigger Deals with LinkedIn
Our proven outbound engine targets decision-makers who actually have budget for enterprise deals
Segmentation That Actually Converts
LinkedIn outbound targets precise demographics with strategic campaign design and scaling methods