🎉Find Prospects and Send Cold Emails & LinkedIn Outbound | All in One Place

LinkedIn Company Page Statistics: What the Numbers Really Tell You (2026)

Table of Contents

LinkedIn Company Page Statistics

  • LinkedIn now has over 1.2 billion users globally – representing a massive professional network with active business decision-makers
  • LinkedIn generates approximately 1.77 billion visits per month – showing people actively use the platform, not just maintaining dormant profiles
  • 4 out of 5 LinkedIn members drive business decisions – providing direct access to buyers, not just passive audience members
  • Members possess 2x the buying power of the average web audience – making LinkedIn users higher-value prospects
  • 44% of users earn more than $75,000 annually – representing decision-makers with actual purchasing budgets
  • 80% of B2B leads generated on social media come from LinkedIn – dominating all other platforms for B2B lead generation
  • 40% of B2B marketers rate LinkedIn as the most effective channel for driving high-quality leads – not just leads, but qualified ones that convert
  • Good engagement rate on LinkedIn is between 1% and 4% – anything above 4% is considered exceptional performance
  • Companies posting at least weekly see 5.6x more follower growth – than those posting less frequently, showing consistency matters
  • PDF carousels average 45.85% engagement rate – making them the highest-performing content format on Company Pages
  • Polls generate 206% more impressions than other post types – though they must be genuinely relevant to avoid engagement bait penalties
  • Posts with images receive 2x higher comment rates – compared to text-only posts, which are now the lowest-performing format
  • Desktop devices accounted for 74.24% of LinkedIn visits – versus only 25.76% mobile between late 2024 and early 2025
  • Personal profiles generate 5x more engagement than Company Pages – and 2.75x more impression reach, serving different strategic purposes
  • Small pages (5,000-10,000 followers) see fastest growth at 35.20% annually – while large pages (100,000-1M) plateau around 21.60%

Here’s something most people don’t realize: your LinkedIn Company Page isn’t just a digital business card anymore—it’s your silent salesperson working 24/7.

When someone gets your cold email or sees your message, what’s the first thing they do? They check you out on LinkedIn. Your Company Page is where trust gets built or destroyed in about 10 seconds.

And right now, the numbers are telling us something surprising.

While everyone’s obsessing over personal profiles and viral posts, the smartest companies are quietly using their Company Pages as lead generation machines. They’re tracking the right metrics, understanding what drives real engagement, and turning followers into qualified leads.

This isn’t about vanity metrics like follower counts. It’s about understanding what actually works in 2025—when buyers are doing 70% of their research before ever talking to sales.

Let’s dive into the linkedin company page statistics that matter, and more importantly, what you should do about them.

The LinkedIn Landscape in 2025

Before we dig into Company Page specifics, you need to understand the playing field.

LinkedIn now has over 1.2 billion users globally. That’s not just big—it’s massive. But here’s what matters more: these aren’t passive scrollers. LinkedIn generates approximately 1.77 billion visits per month, which means people are actively using the platform, not just letting their profiles collect dust.


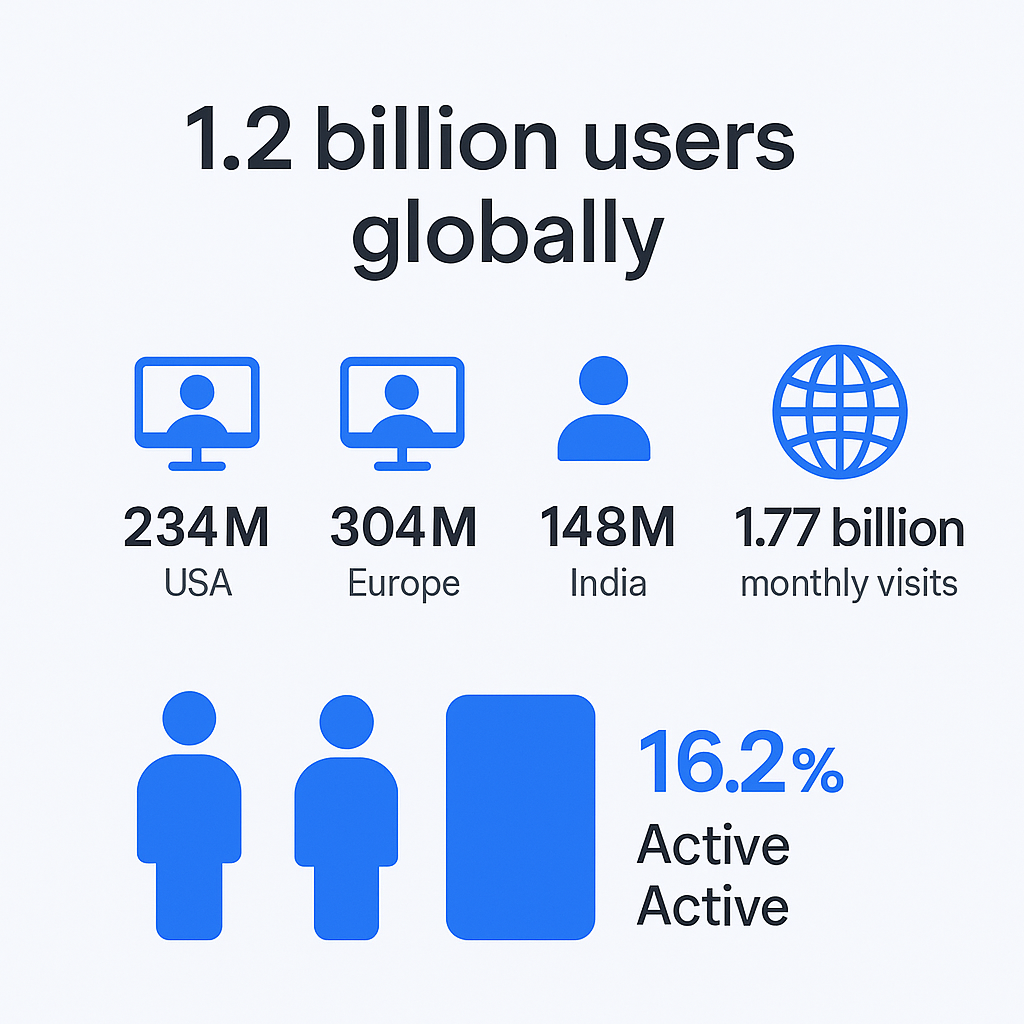
The platform’s reach is truly global. The United States leads with 234 million members, but Europe accounts for over 304 million users, and India has exploded to 148 million members. If you’re thinking LinkedIn is just for North American markets, think again.

Here’s where it gets interesting for business: 4 out of 5 LinkedIn members drive business decisions. Compare that to any other social media platform. On Facebook or Instagram, you’re competing for attention with vacation photos and memes. On LinkedIn, you’re reaching people in a business mindset with actual buying power.

In fact, members possess 2x the buying power of the average web audience, and 44% of users earn more than $75,000 annually. These aren’t random internet browsers—they’re decision-makers with budgets.

Why Company Pages Matter More Than You Think

Let’s talk about something called the “Silent Buyer” phenomenon.

80% of B2B leads generated on social media come from LinkedIn. Not Facebook. Not Twitter (or X, or whatever it’s called now). LinkedIn. And when those leads are researching you, they’re not just looking at individual profiles—they’re checking out your Company Page to validate whether you’re legit.

Think about your own behavior. When you get an interesting cold email, you Google the company and check their LinkedIn page, right? You’re looking for signs of life: recent posts, employee count, whether they seem like a real company or someone operating out of their garage (not that there’s anything wrong with garages, but you get it).

Here’s the stat that should wake you up: 40% of B2B marketers rate LinkedIn as the most effective channel for driving high-quality leads. Not just leads—high-quality leads. The kind that actually close.

🎯 Skip the Page Building. Start Pipeline Building.

We deliver 15-25% response rates through direct LinkedIn outreach—no page optimization required

But most companies treat their Company Pages like forgotten stepchildren. They set them up during onboarding, post sporadically, and wonder why nothing happens.

The Numbers That Actually Matter

Let’s cut through the noise and talk about metrics that drive real business outcomes.

Engagement Rates: The Reality Check

Here’s what you need to know: a “good” engagement rate on LinkedIn is between 1% and 4%. Anything above 4% is considered exceptional.

But—and this is important—it varies wildly by industry:


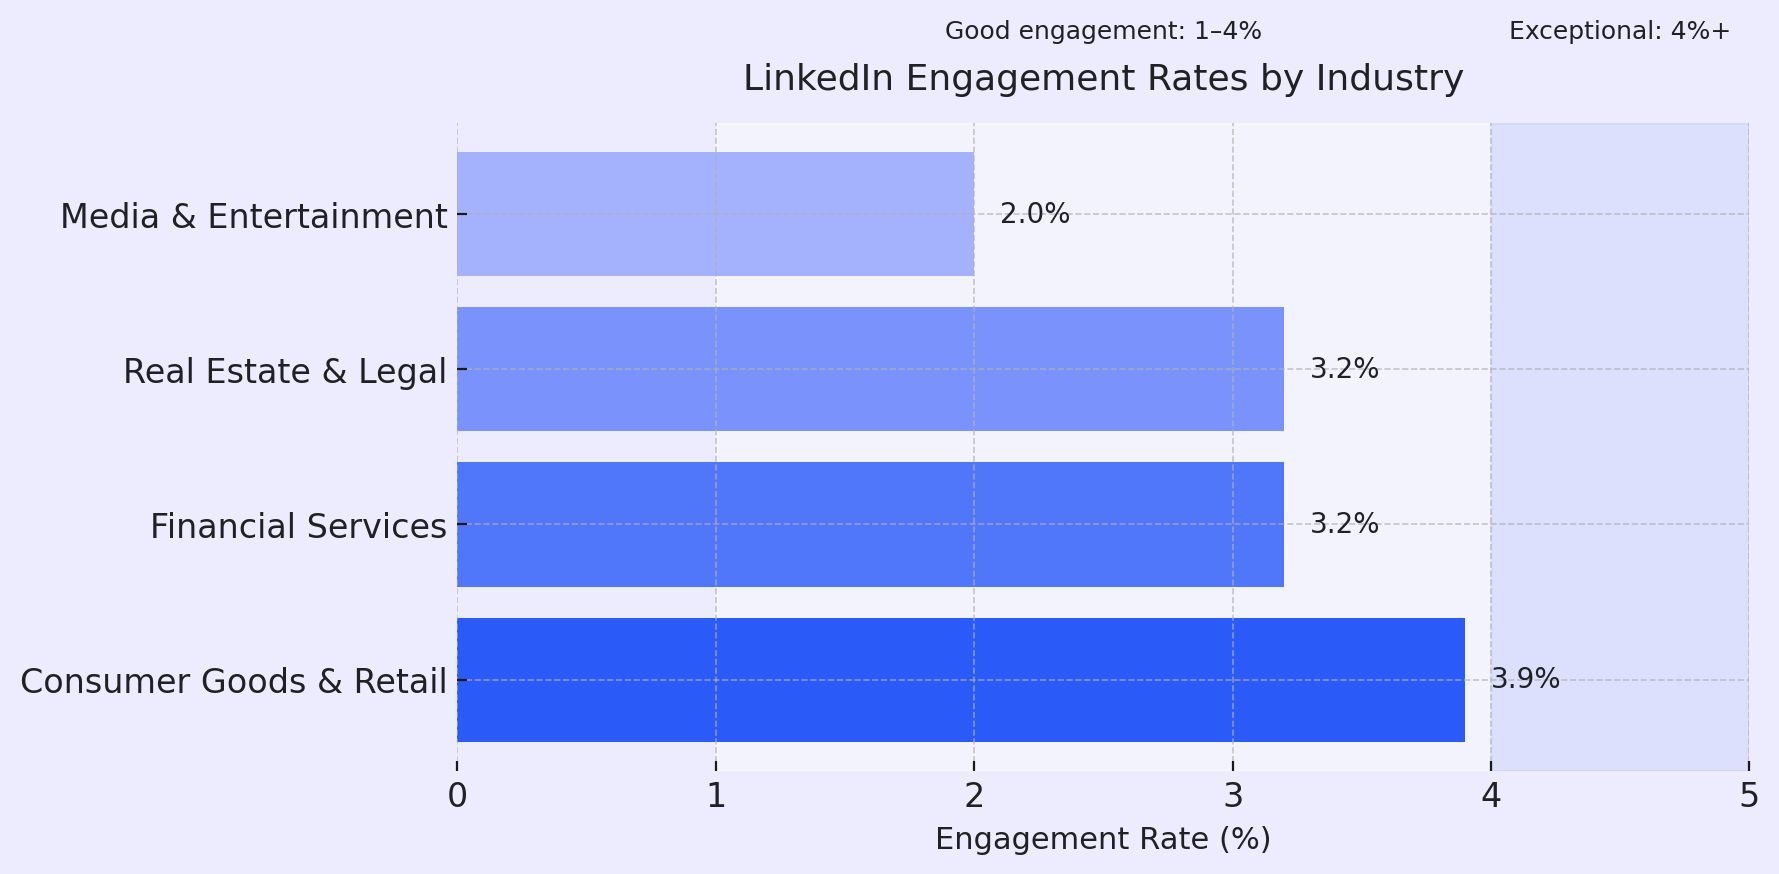
  • Financial Services: 3.2% average engagement
  • Real Estate & Legal: 3.2% average engagement
  • Media & Entertainment: 2.0% average engagement

If you’re in tech or professional services and seeing 2% engagement, you’re actually doing okay. If you’re in retail and getting 2%, you’ve got room to improve.

The engagement rate formula is simple: (Clicks + Likes + Comments + Shares + Follows) ÷ Impressions. Track this for every post and you’ll quickly see what resonates with your audience versus what falls flat.

Follower Growth: Speed Matters Less Than Consistency

The data shows something counterintuitive about follower growth.

Small pages (5,000-10,000 followers) see the fastest percentage growth at 35.20% annually. Mid-sized pages (10,000-50,000 followers) grow at 22.80%, while large pages (100,000-1M followers) plateau around 21.60%.

Translation? It’s easier to grow when you’re smaller. Your network effect is stronger, and every employee connection matters more.

But here’s the game-changer: Companies that post at least weekly see 5.6x more follower growth than those that post less frequently. That’s not a typo. 5.6 times more growth just from showing up consistently.

 Posting Weekly for Months? Or Meetings This Week?

Get qualified pipeline now with our complete LinkedIn outreach strategy—targeting, messaging, and scaling included

Think about what that means. You don’t need to go viral. You don’t need to post every day. You just need to show up weekly with valuable content.

Content Performance: What Actually Works

Let’s talk about what performs in 2025, because the algorithm has shifted dramatically.

PDF carousels (document posts) are crushing it with an average engagement rate of 45.85%. Why? Because they force people to spend time with your content. They swipe through multiple slides, and the algorithm interprets that as high interest.

Polls generate 206% more impressions than other post types. But—and this is crucial—the algorithm is getting smarter about “engagement bait.” Your polls need to be genuinely relevant to your industry, not “coffee or tea” nonsense.

Here’s a surprise: text-only posts are now the lowest-performing format across the board. Posts with images receive 2x higher comment rates. The visual aspect matters more than ever because LinkedIn’s feed is increasingly crowded.

The Device Divide

This stat changes everything about how you create content: between late 2024 and early 2025, desktop devices accounted for 74.24% of LinkedIn visits, while mobile devices accounted for only 25.76%.


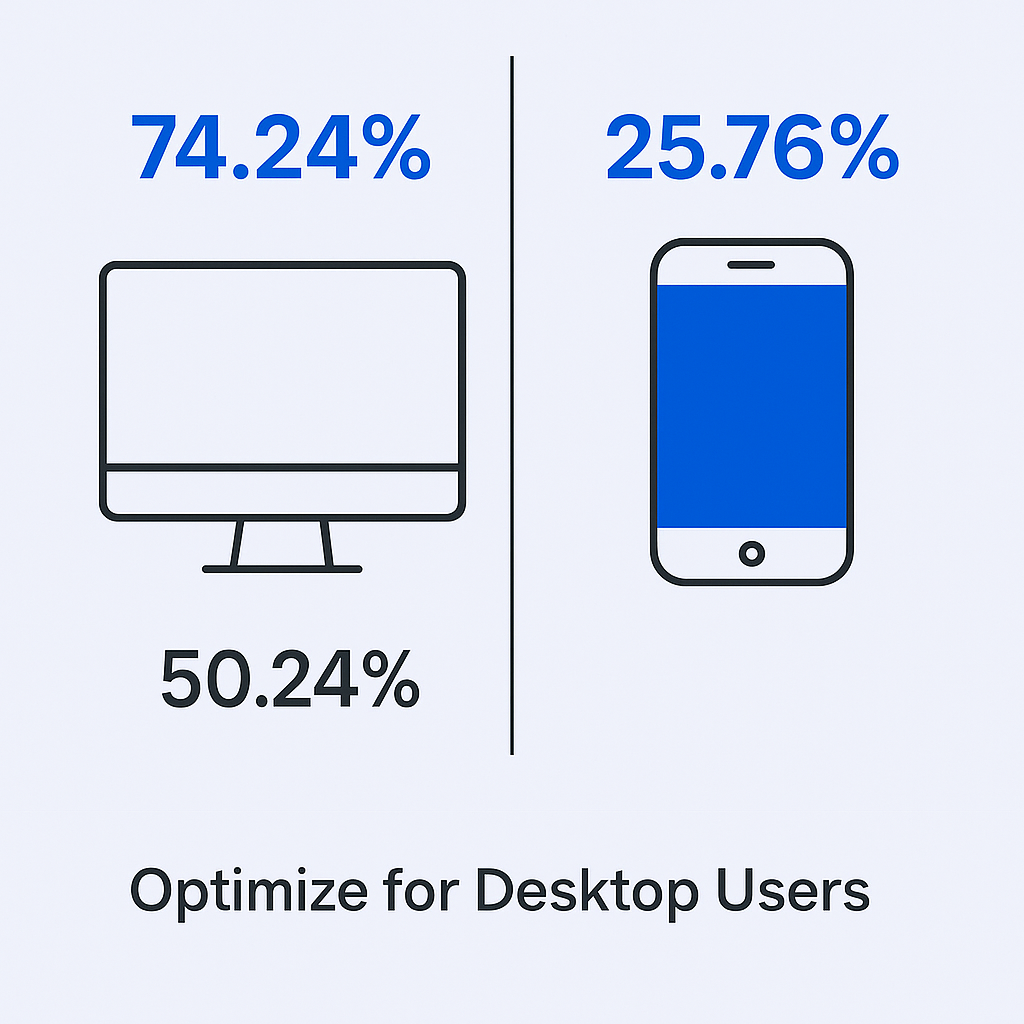
People are viewing your content on large screens during work hours. They’re in a professional mindset. They can read longer posts, view detailed infographics, and actually click through to your website. This isn’t scroll-and-forget content consumption—it’s intentional research.Most social media platforms are mobile-first. LinkedIn is desktop-first. What does that mean for you?


Create content for people sitting at desks, not lying in bed scrolling on their phones.

The Analytics Report: What to Track and Why

Understanding linkedin analytics is where most companies fall apart. They look at vanity metrics and miss the signals that actually predict business outcomes.

Visitor Demographics: Your Secret Weapon

Here’s something powerful that most people don’t use: your analytics report breaks down visitors by Job Function, Location, Seniority, Industry, and Company Size.

This is gold for anyone doing targeted outreach. Imagine seeing a spike in visitors from “IT Decision Makers” in “Austin, Texas” at companies with “200-500 employees.” That’s not random—that’s a signal that someone (or multiple people) from your target account is actively researching you.

You can’t see individual names (thank you, privacy policy cookie settings), but you can see aggregate patterns that reveal buying committee activity.

Update Analytics: Content Forensics

Every post you publish generates its own analytics report. Track these metrics religiously:

  • Impressions: How many times was it shown?
  • Click-Through Rate (CTR): Did people actually click your links?
  • Engagement Rate: Did they interact or just scroll past?
  • Social Actions: Likes, comments, shares—the full spectrum

Run this simple test: compare your posts from the last 90 days. Which posts got the highest engagement? What topic? What format? What time of day?

Your audience is literally telling you what they want to see more of. Listen to them.

Follower Analytics: Know Your Audience

Understanding who follows you helps you create better content. Your linkedin analytics report shows:

  • Total followers (organic vs. sponsored)
  • Follower demographics (similar to visitor data)
  • Growth trends over time

But here’s what’s really useful: tracking sudden spikes. When you see a rapid increase in followers, something triggered it—a viral post, a press mention, or a marketing campaign. Dig into what caused it and do more of that.

Competitive Intelligence: The Hidden Feature

Most people don’t know this exists: LinkedIn has a “Competitors to Track” feature where you can monitor up to 9 competitor pages.

You can see their:

  • Total follower count
  • New follower growth
  • Number of posts
  • Engagement rates

This is essentially free market research. If a competitor’s engagement suddenly jumps, go look at their recent posts. What are they doing differently? What topics are resonating?

Don’t copy them—learn from them. Use their validated successes to inform your own strategy.

Personal Profiles vs. Company Pages: The Truth

Let’s address the elephant in the room: personal profiles generate 5x more engagement and 2.75x more impression reach than Company Pages.

💡 Why Wait for Engagement? Start Conversations.

Our LinkedIn outbound engine reaches 65M+ decision-makers directly with proven targeting and campaign frameworks

So why bother with Company Pages at all?

Because they serve different purposes. Your Company Page is your credibility layer. It’s where people verify you’re a legitimate business. It’s your landing page for paid ads. It’s your source of truth.

Think of it this way: Personal profiles are for reach and influence. Company Pages are for trust and validation.

The smartest strategy? Use both. Create engaging content from personal profiles to build relationships and drive visibility. Use your Company Page as the destination that converts interest into leads.

Companies like Storylane understand this. They have executives and employees creating content from personal profiles, which now drives over 50% of their sales pipeline. But that content ultimately leads back to the Company Page where prospects can learn more, explore products, and convert.

Privacy, Policy, and Data Compliance

Quick but important note: when you’re using tools to analyze LinkedIn data or create linkedin analytics reports, you need to understand the agreement privacy requirements.

LinkedIn tracks visitors using cookies (specifically through their privacy policy cookie setup). When you export data or use third-party analytics tools, ensure you’re:

  • Not attempting to identify individual visitors (that violates the agreement privacy policy)
  • Only using aggregate data
  • Complying with GDPR and CCPA requirements

This matters because scraping LinkedIn data at scale can get your account banned. Stick to official integrations and respect the platform’s terms.

What This Means for Your Strategy

Here’s how to actually use these linkedin company page statistics:

Post Consistently: The 5.6x growth multiplier from weekly posting isn’t negotiable. Block time every week to create content. Batch create if you need to, but show up.

Track Engagement Patterns: Stop posting randomly. Look at your linkedin analytics report and double down on what’s working. If polls perform well for you, do more polls. If case studies get traction, create more case studies.

Optimize for Desktop: Remember that 74% of viewers are on desktop. Use detailed graphics, longer-form content, and professional formatting that looks good on large screens.

Mix Formats: Experiment with PDF carousels, video content, and image posts. The algorithm rewards variety, and different formats appeal to different audience segments.

Monitor Competitor Activity: Check your competitors monthly. Are they trying something new? Is it working? Use that intelligence to stay ahead.

Use Your Page for Lead Generation: Stop thinking of your Company Page as a broadcast channel. It’s a lead generation tool. Every post should have a purpose: educate, build trust, or drive action.

The LinkedIn + Cold Outreach Connection

Here’s where this all ties together with modern cold email strategies.

Your LinkedIn Company Page acts as credibility verification for your outreach efforts. When someone receives your cold email, they’re going to Google you. They’ll check your website, and they’ll absolutely check your LinkedIn presence.

A dormant Company Page with 47 followers and a post from 2022? That’s a red flag. An active page with recent content, growing followers, and genuine engagement? That’s social proof.

The smartest approach combines channels: use cold email to start conversations, but ensure your LinkedIn presence supports and validates those conversations. It’s not either/or—it’s both working together.

🚀 We Handle Both: LinkedIn + Email Outbound

Full-service outbound engine delivering 15-25% response rates with complete targeting, design, and scaling execution

7-day Free Trial |No Credit Card Needed.

Some companies are taking this further by using LinkedIn for social selling, where they build relationships through the platform first, then move to email. The linkedin company page analytics help them identify which companies and roles are already showing interest.

Conclusion

LinkedIn Company Pages aren’t optional anymore—they’re essential.

The statistics show that LinkedIn dominates B2B lead generation, with 80% of B2B social media leads coming through the platform. But success requires more than just having a page. You need to understand engagement benchmarks, track the right metrics, and create content that resonates with decision-makers.

The winning formula is simple: post consistently (at least weekly), focus on visual and document-based content, track your analytics report religiously, and optimize based on what the data tells you.

Your Company Page isn’t competing with personal profiles—it’s the trust anchor that makes everything else work. Personal profiles drive reach and engagement. Company Pages provide validation and conversion paths.

Start today. Review your last 10 posts, identify which formats performed best, and commit to a weekly posting schedule. Check your linkedin analytics to understand who’s already visiting your page and what they care about.

Remember: 40% of B2B marketers consider LinkedIn their most effective channel. The question isn’t whether to invest in your LinkedIn presence—it’s whether you can afford not to.

FAQs

What are the most important linkedin company page statistics to track?

The essential metrics are engagement rate (aim for 1-4%), follower growth rate (consistency matters more than speed), post impressions, click-through rates, and visitor demographics. Your linkedin analytics report should be reviewed weekly to spot trends and identify what content resonates most with your target audience.

How often should I post on my LinkedIn Company Page?

Data shows that companies posting at least once per week see 5.6x more follower growth than those posting less frequently. The sweet spot is 3-5 times per week. Consistency beats frequency—it's better to post once weekly reliably than three times one week and zero the next.

What is a good engagement rate for a LinkedIn Company Page?

A good engagement rate typically falls between 1% and 4%, though this varies by industry. Consumer goods and retail average 3.9%, while media and entertainment average 2.0%. Anything above 4% is considered exceptional. Calculate engagement rate using: (Clicks + Likes + Comments + Shares + Follows) ÷ Impressions.

Can I see who visits my LinkedIn Company Page?

No, you cannot see individual visitor names due to privacy policy restrictions. However, your analytics report provides aggregate demographic data including visitor job functions, locations, seniority levels, industries, and company sizes. This anonymous data is valuable for understanding which segments are interested in your content.

How do LinkedIn Company Pages compare to personal profiles for engagement?

Personal profiles generate 5x more engagement and 2.75x more impression reach than Company Pages. However, they serve different purposes. Personal profiles excel at building relationships and visibility, while Company Pages provide credibility, enable paid advertising, and serve as conversion destinations. The most effective strategy uses both in tandem.

Scale LinkedIn Without The Tech Headaches

Get 15-25% Response Rates With Our Done-For-You LinkedIn Outbound Engine

Segmentation That Actually Converts

LinkedIn outbound targets precise demographics with strategic campaign design and scaling methods

How to Build a High-Converting B2B Sales Funnel from Scratch on LinkedIn ​