LinkedIn Networking Statistics: Numbers That Actually Matter
- Sophie Ricci
- Views : 28,543
Table of Contents
LinkedIn Networking Statistics
- 1 billion+ members across 200 countries, projected to reach 942 million active users by 2028 – growing at 2-3 new members per second, largest professional network with serious buying power concentration
- 65 million decision-makers and 10 million C-level executives actively on platform – plus 180 million senior-level influencers, with 4 out of 5 LinkedIn members driving business decisions in some capacity
- 53% of U.S. users earn $100K+ annually with 41% of members being millionaires – educated high-earning professionals actively using LinkedIn for business purposes, not casual browsing
- 25-34 years old (Millennials) comprise 47-60% of users – dominant demographic now occupying management, director, VP-level positions preferring authentic digital-first communication over formal outreach
- 310 million people use LinkedIn actively each month, 134.5 million check daily – 69% of U.S. users checking LinkedIn every single day with average session lasting 8-14 minutes
- 57% of traffic from mobile devices, 73% of video views happen on mobile – mobile-first reality requiring outreach optimized for small screens with narrow attention windows
- Native video posts receive 5x more engagement than static posts – live video crushing even harder with 24x more engagement, carousels achieving 6.6% engagement rate
- Connection acceptance: 30% average, 45-50% top performers, up to 74% with hyper-personalization – personalized requests achieving 45% acceptance vs 15% for generic (200% improvement)
- 21% of acceptances within first 60 minutes, 63% within 24 hours, 88% within 7 days – if someone hasn’t accepted after week they likely never will, withdraw pending requests after 7-14 days
- Safe limit roughly 100 connection requests per week (20 per weekday) – pushing beyond this risking account restrictions, requiring strategic pacing for account health
- InMail response rate: 18-25% vs cold email 1-5% – InMail open rate 57-85% with 65% of responses arriving within 24 hours, 90% within one week
- InMails under 400 characters get 22% higher response rates – sweet spot 50-125 words (2-3 sentences), over 1,200 characters seeing 11% fewer responses
- High SSI scorers create 45% more opportunities, 51% more likely to hit revenue targets – getting promoted 17 months faster with 78% of social sellers outselling peers not using networking
- Campaigns using 3+ channels achieve 287% higher purchase rates vs single-channel – LinkedIn + Email delivering 3x better conversion rates, combined reply rates hitting ~15% vs ~5% email alone
- 72-95% of recruiters use LinkedIn for candidate sourcing – 7 people hired every minute, but hidden market: 85% of jobs filled through networking not postings, 70% never published publicly
Let’s cut through the noise. LinkedIn isn’t just another social platform—it’s where business actually happens.
With over 1 billion users and growing at 2-3 new members per second, LinkedIn has become the primary playground for professional networking, business development, and revenue generation. But here’s what matters: the platform hosts 65 million decision-makers and 10 million C-level executives who are actively looking to connect, learn, and do business.
The difference between professionals who struggle to generate opportunities and those who consistently land meetings comes down to one thing: understanding the data behind effective networking.
This guide breaks down the LinkedIn networking statistics that actually move the needle—from connection acceptance rates to message response patterns to the engagement tactics that drive real results.
LinkedIn Networking Statistics: The Numbers That Matter
The Scale of Opportunity
LinkedIn’s growth trajectory tells a compelling story about where professional networking is headed:
1 billion+ members across 200 countries and territories make LinkedIn the largest professional network in existence. Experts project this will hit 942 million active users by 2028.
But size isn’t everything. What makes LinkedIn powerful is who’s on the platform. 53% of U.S. users earn $100,000+ annually, and remarkably, 41% of LinkedIn members are millionaires. When you’re networking on LinkedIn, you’re connecting with people who have serious buying power.
The decision-maker density is staggering. Beyond the 65 million decision-makers, there are 180 million senior-level influencers on the platform. Even more impressive: 4 out of 5 LinkedIn members drive business decisions in some capacity.
📊 Outperform Cold Email By 500%
LinkedIn outbound delivers 15-25% response rates vs email’s 1-5%. Get our complete targeting, campaign design, and scaling system that bypasses spam filters and reaches verified decision-makers.
Who’s Actually On LinkedIn
Understanding LinkedIn’s audience demographics helps you tailor your approach:
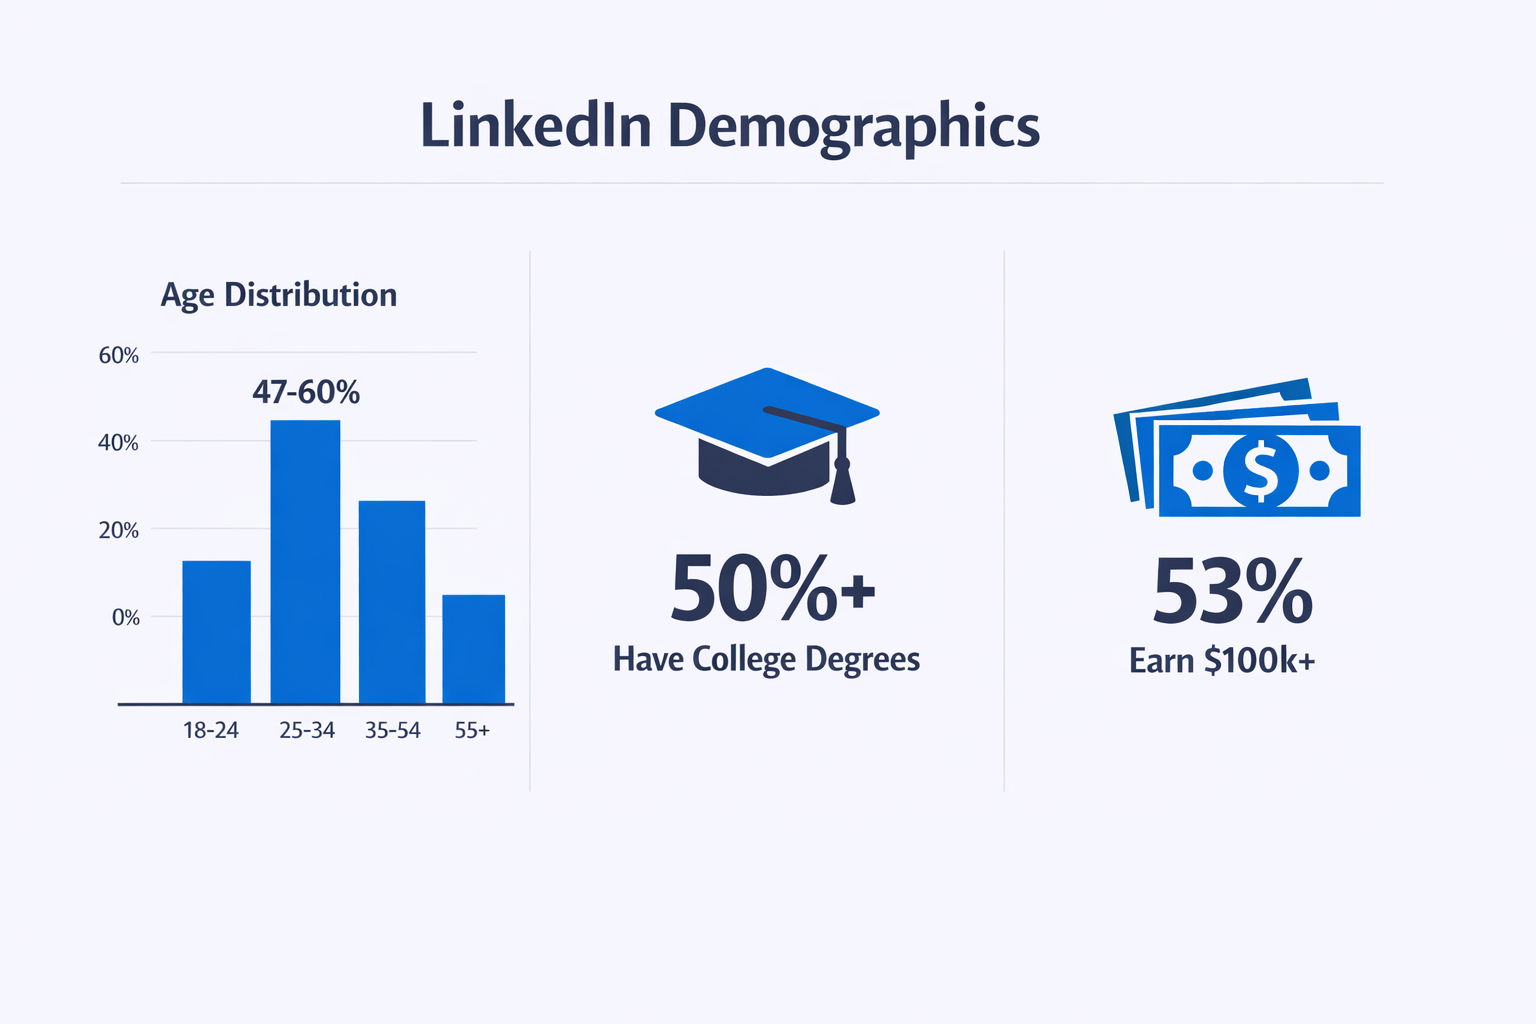
Age Distribution:
- 25-34 years old (Millennials): 47-60% of users—the dominant demographic
- 18-24 years old (Gen Z): 22-29% of users—rapidly growing
- 55+ years old: 3-4% of users—smaller but highly influential
The Millennial dominance is critical. This generation now occupies management, director, and VP-level positions. They prefer authentic, digital-first communication over formal, lengthy outreach. If your networking strategy still reads like a 1990s business letter, you’re already losing.
Education and Income:
- 50%+ hold a college degree or higher
- In the U.S., 33% hold a bachelor’s degree and 18% hold a master’s degree
- 53% belong to high-income households earning $100,000+ per year
This isn’t a platform for casual browsing. These are educated, high-earning professionals actively using LinkedIn for business purposes. When implementing advanced LinkedIn search techniques, you’re accessing a uniquely qualified audience.

Platform Engagement: How Active Are Users Really?
One myth needs busting: LinkedIn isn’t a static resume database. It’s a thriving, active ecosystem:
310 million people use LinkedIn actively each month. That’s not accounts—that’s real humans logging in and engaging. 134.5 million users check the platform daily.
Here’s what’s fascinating: 69% of U.S. users check LinkedIn every single day. The average session lasts 8-14 minutes, which creates a crucial insight: you have a very narrow window to capture attention.
Mobile vs Desktop Usage:
- 57% of traffic comes from mobile devices
- 73% of video views happen on mobile
This mobile-first reality means your outreach must be optimized for small screens. Connection requests, messages, and LinkedIn growth hacking tactics all need to work perfectly on a 6-inch screen.
🎯 Generate 15-25% Response Rates
Stop wasting time on low-yield tactics. Our LinkedIn outbound system targets verified decision-makers with personalized campaigns that actually get replies. Complete targeting methodology, campaign frameworks, and scaling playbooks included.
Content That Actually Gets Engagement
Not all LinkedIn content performs equally. The algorithm has clear preferences:
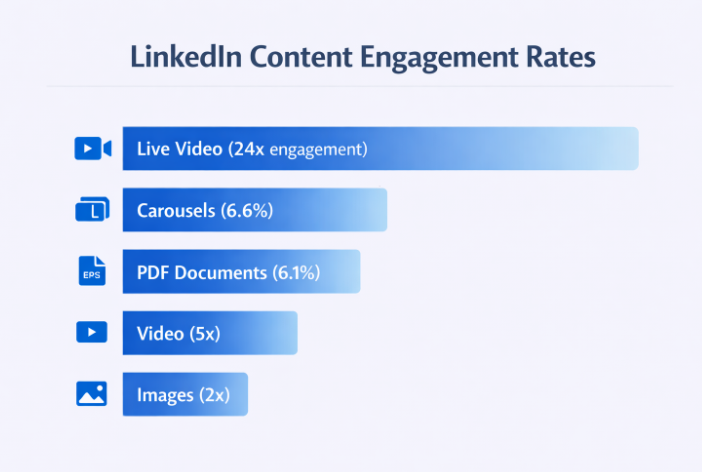
Video dominates everything. Native video posts receive 5x more engagement than static posts. Live video crushes even harder with 24x more engagement.
But if video isn’t your thing, here are other high-performing formats:
- Carousels: 6.6% engagement rate
- PDF Documents: 6.1% engagement rate
- Images: 2x higher comment rates than text-only posts
Timing matters too. The data shows clear patterns:
- Best days: Tuesday, Wednesday, Thursday
- Peak hours: 9 AM – 12 PM and 1 PM – 4 PM
- Avoid: Monday mornings (internal meetings) and weekends (lower business content engagement)
For professionals managing multiple outreach channels alongside Apollo alternatives, understanding these engagement windows maximizes every interaction.

The Connection Request Game
Connection requests are the foundation of LinkedIn networking. Understanding acceptance rates helps you benchmark performance:
Average acceptance rate: 30% Top performer rate: 45-50% Exceptional campaigns: Up to 74% with hyper-personalization
Industry variations matter:
- Technology: ~35% acceptance rate
- Healthcare: ~28% acceptance rate
- Finance: ~25% acceptance rate
The personalization debate: Data shows personalized requests achieve 45% acceptance rates compared to 15% for generic ones—a 200% improvement. However, the note must add value, not pitch.
Timing is critical:
- 21% of acceptances happen within the first 60 minutes
- 63% of acceptances occur within 24 hours
- 88% of acceptances happen within 7 days
If someone hasn’t accepted after a week, they likely never will. Withdraw pending requests after 7-14 days to maintain account health.
Weekly limits: The safe limit is roughly 100 connection requests per week (about 20 per weekday). Push beyond this, and you risk account restrictions.
💼 Access 65M Decision-Makers Directly
LinkedIn outbound skips gatekeepers and spam folders entirely. Our proven system generates qualified meetings through systematic targeting and campaign optimization—no technical setup, no deliverability issues, no guesswork.
Messaging That Converts
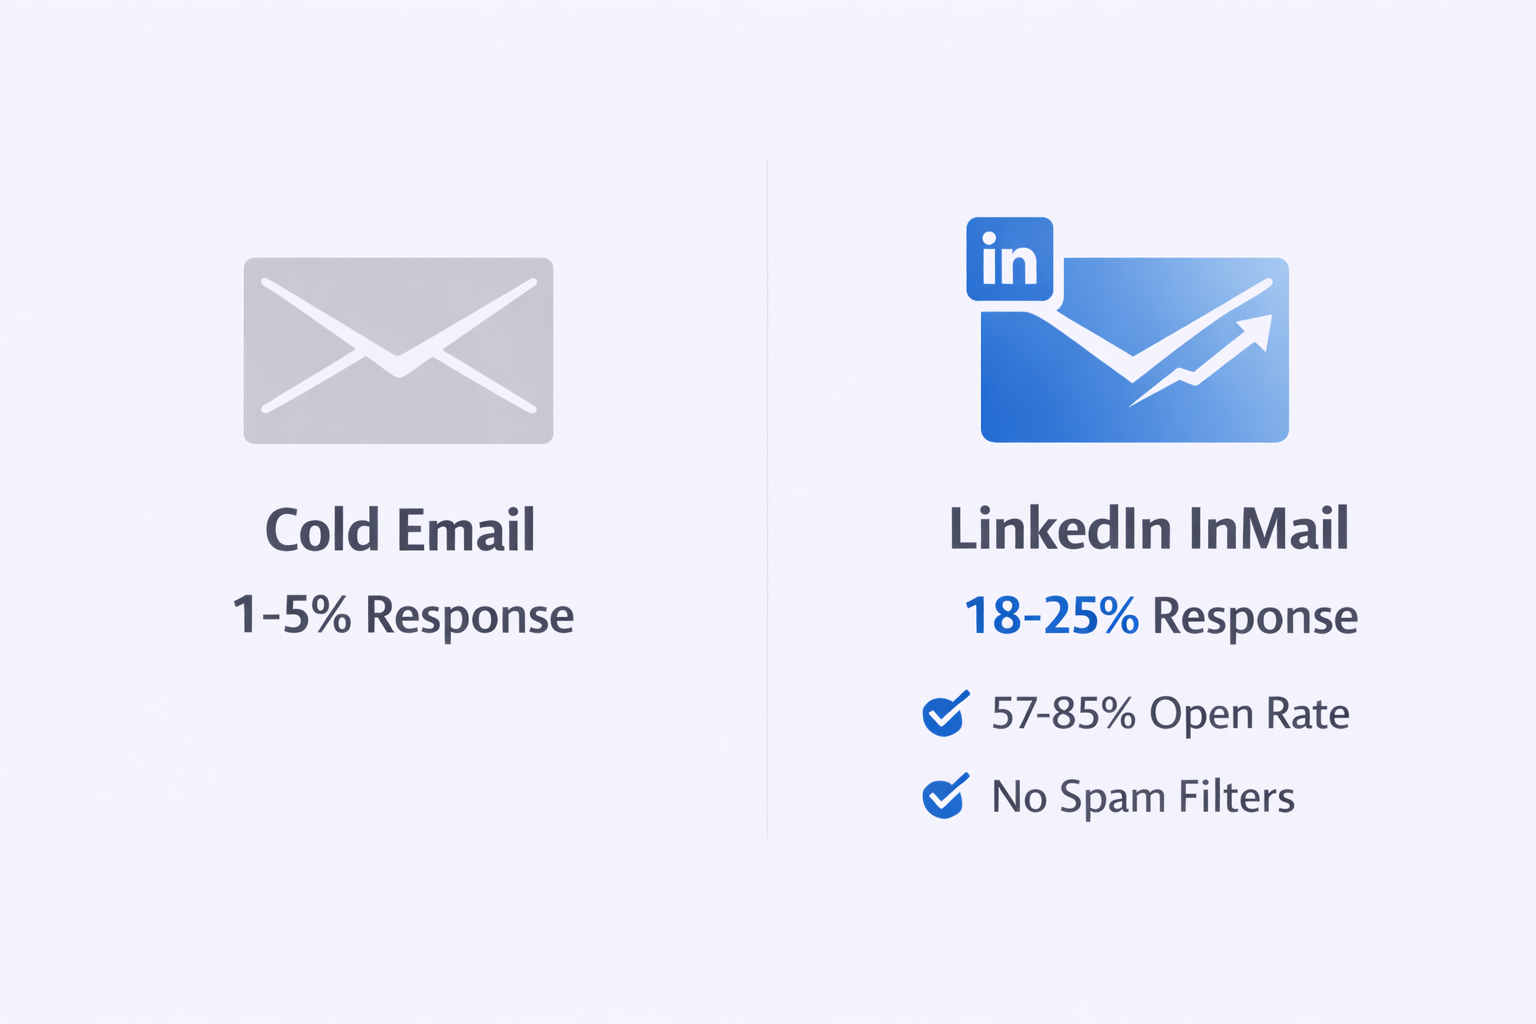
Once connected, your messaging strategy determines ROI. The contrast between InMail and traditional cold email is striking:
InMail vs Cold Email:
- InMail response rate: 18-25%
- Cold email response rate: 1-5%
- InMail open rate: 57-85%
Message length dramatically impacts response:
- InMails under 400 characters get 22% higher response rates
- InMails over 1,200 characters see 11% fewer responses
- Sweet spot: 50-125 words (2-3 sentences)
Response timing:
- 65% of InMail responses arrive within 24 hours
- 90% of responses come within one week
Subject line optimization:
- 1-3 word subject lines often perform best
- Personalized subject lines increase open rates by 26%
- Mentioning a mutual connection boosts response by 27%
This data validates why many teams pivot from traditional cold email to LinkedIn-first approaches, especially when considering email blacklist challenges that plague traditional outbound.

he Social Selling Index Impact
LinkedIn quantifies networking effectiveness through the Social Selling Index (SSI)—a score from 0 to 100 based on four pillars: professional brand, finding the right people, engaging with insights, and building relationships.
The impact is measurable:
- High SSI scorers create 45% more opportunities
- They’re 51% more likely to hit revenue targets
- They get promoted 17 months faster than low scorers
Broader social selling statistics:
- 78% of social sellers outsell peers who don’t use professional networking
- Companies with consistent social selling processes are 40% more likely to hit revenue goals
- 75% of buyers use social media to inform purchase decisions
- 82% of buyers trust companies with active leadership on social platforms
When LinkedIn business statistics show this level of correlation between platform activity and business outcomes, ignoring networking becomes a competitive disadvantage.
🚀 Turn LinkedIn Into Your Revenue Engine
While others guess at outreach, we provide the complete system: targeting frameworks that find your ideal prospects, campaign templates proven to drive responses, and scaling methods that maintain quality at volume.
7-day Free Trial |No Credit Card Needed.
The Recruiter Signal
Recruiter statistics reveal hidden opportunities. When companies hire, they typically have budget for new tools and solutions:
Recruiter platform usage:
- 72-95% of recruiters use LinkedIn to find candidates
- 7 people are hired every minute on LinkedIn
- 101 job applications submitted every second
- 65 million people search for jobs weekly
The hidden market insight:
- 85% of jobs are filled through networking, not job postings
- 70% of jobs are never published publicly
For those extracting contact data beyond LinkedIn, understanding how to get phone numbers creates additional outreach channels to complement your networking strategy
Multichannel Mastery
LinkedIn delivers impressive results alone, but combining it with other channels multiplies effectiveness:
The multichannel advantage:
- Campaigns using 3+ channels achieve 287% higher purchase rates vs single-channel
- LinkedIn + Email delivers 3x better conversion rates
- Combined reply rates hit ~15% vs ~5% for email alone
- LinkedIn-first sequences see 128% increases in engagement
Optimal sequence example:
- Day 1: LinkedIn profile view (notification)
- Day 2: Personalized connection request
- Day 3: LinkedIn voice note or video
- Day 5: Email referencing LinkedIn connection
- Day 7: Phone call referencing email
When prospects see your name across multiple touchpoints, the “mere exposure effect” builds familiarity and trust. They recognize your name from LinkedIn when your email arrives, dramatically increasing open rates.
While some compare Shopify merchant statistics to LinkedIn B2B data, the professional networking audience offers unique advantages for business development.
Conclusion
LinkedIn networking statistics tell a clear story: this platform has become the primary engine for professional relationship building and business development.
The numbers validate what top performers already know:
- 1 billion+ users includes 65 million decision-makers with real buying authority
- 18-25% response rates crush traditional cold email’s 1-5%
- 45-50% connection acceptance rates are achievable with personalization
- 287% higher conversion comes from multichannel integration
- 51% higher quota attainment correlates with strong social selling
The opportunity is massive, but so is the noise. Success requires data-driven strategy: targeting the right people, crafting messages under 400 characters, engaging Tuesday through Thursday during peak hours, and building a consistent presence that drives trust.
The hidden market of opportunities unlocks through networking. Those who align their activities with these statistical realities move from hopeful outreach to predictable opportunity generation.
.
FAQs
Should I send connection requests with or without a note?
How many connection requests can I safely send daily?
What's the best time to send LinkedIn messages?
Does my Social Selling Index (SSI) actually matter?
Why aren't my messages getting responses?
- blog
- Statistics
- LinkedIn Networking Statistics 2026: Essential Data & Insights