
The Creator Gap: Winners and Losers
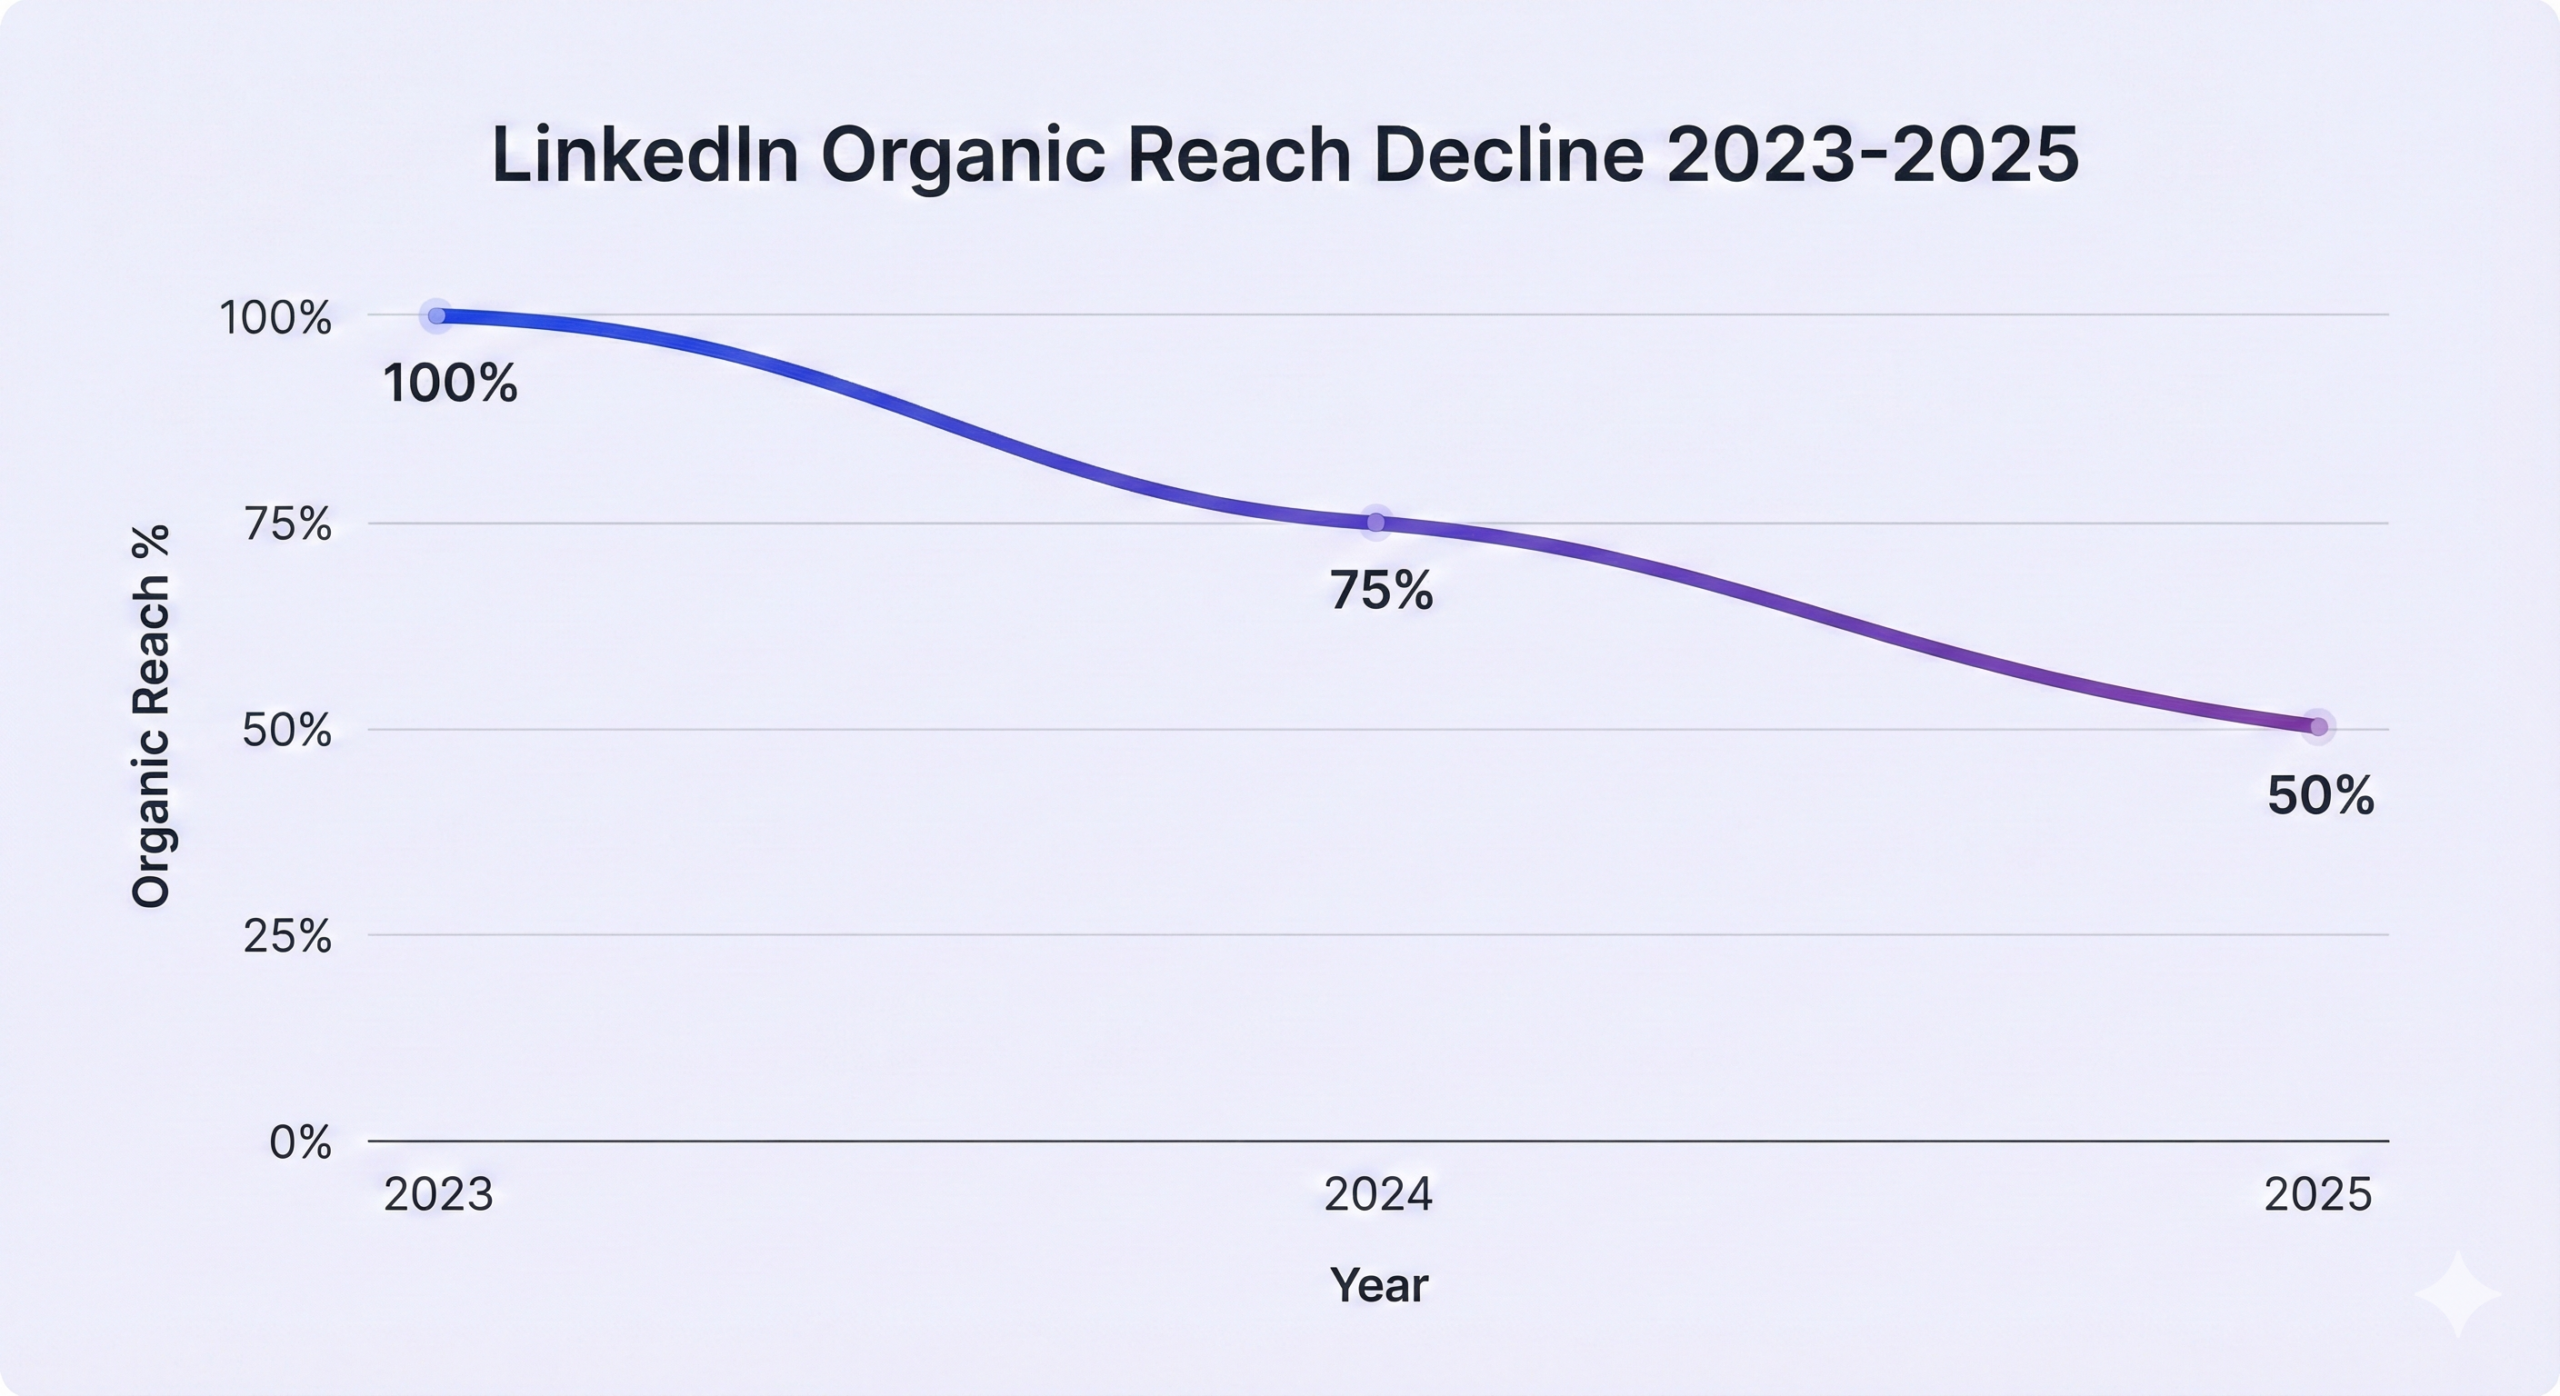
The data reveals a disturbing trend. Since 2022, visibility for posts by Top Creators has jumped from 15% to 31%, while visibility for regular users has crashed from 57% to 28%.
The algorithm is creating a winner-takes-all dynamic. Consistent, authoritative voices dominate while casual posters get buried. Sporadic posting signals to the system that you’re a “consumer,” not a “creator.”
For anyone building professional presence, this means consistency matters more than ever. Post irregularly and you’re effectively invisible.
Engagement Rates: The Silver Lining
Here’s the counterintuitive good news: while reach is down, engagement quality is up.
The overall engagement rate by impressions in the first half of 2025 stood at 5.20%. This represents healthy interaction from a more attentive audience.
Throughout 2024, engagement rates grew steadily from 4.48% in January to 5.42% in December. The trend peaked at 5.76% in March 2025 before stabilizing.
What this means: your audience is smaller but more engaged. A post with 500 views and 20 meaningful comments beats a viral post with 50,000 views from irrelevant connections every time.
How the Algorithm Actually Works
LinkedIn evaluates every post through a three-stage filter:
Stage 1: Initial Classification (First 60 Minutes)
AI immediately scans for spam indicators, relevance to your profile, and content originality. Posts with excessive hashtags, poor grammar, or copied content get filtered out.
Stage 2: Engagement Testing
Your post goes to a small “test bucket” of connections—people who’ve recently engaged with you. The algorithm measures how quickly they react. Early comment velocity in the first 60-120 minutes is critical.
Not all engagement is equal. A Like is a weak signal. A Comment carries roughly 2x weight. A Share or Save is the gold standard.
Stage 3: Extended Distribution
If your test bucket engages enthusiastically, the post graduates to second and third-degree connections. This is where organic reach truly happens.
The first hour determines everything. Post and disappear, and your content dies. You need to be available to respond to comments immediately.
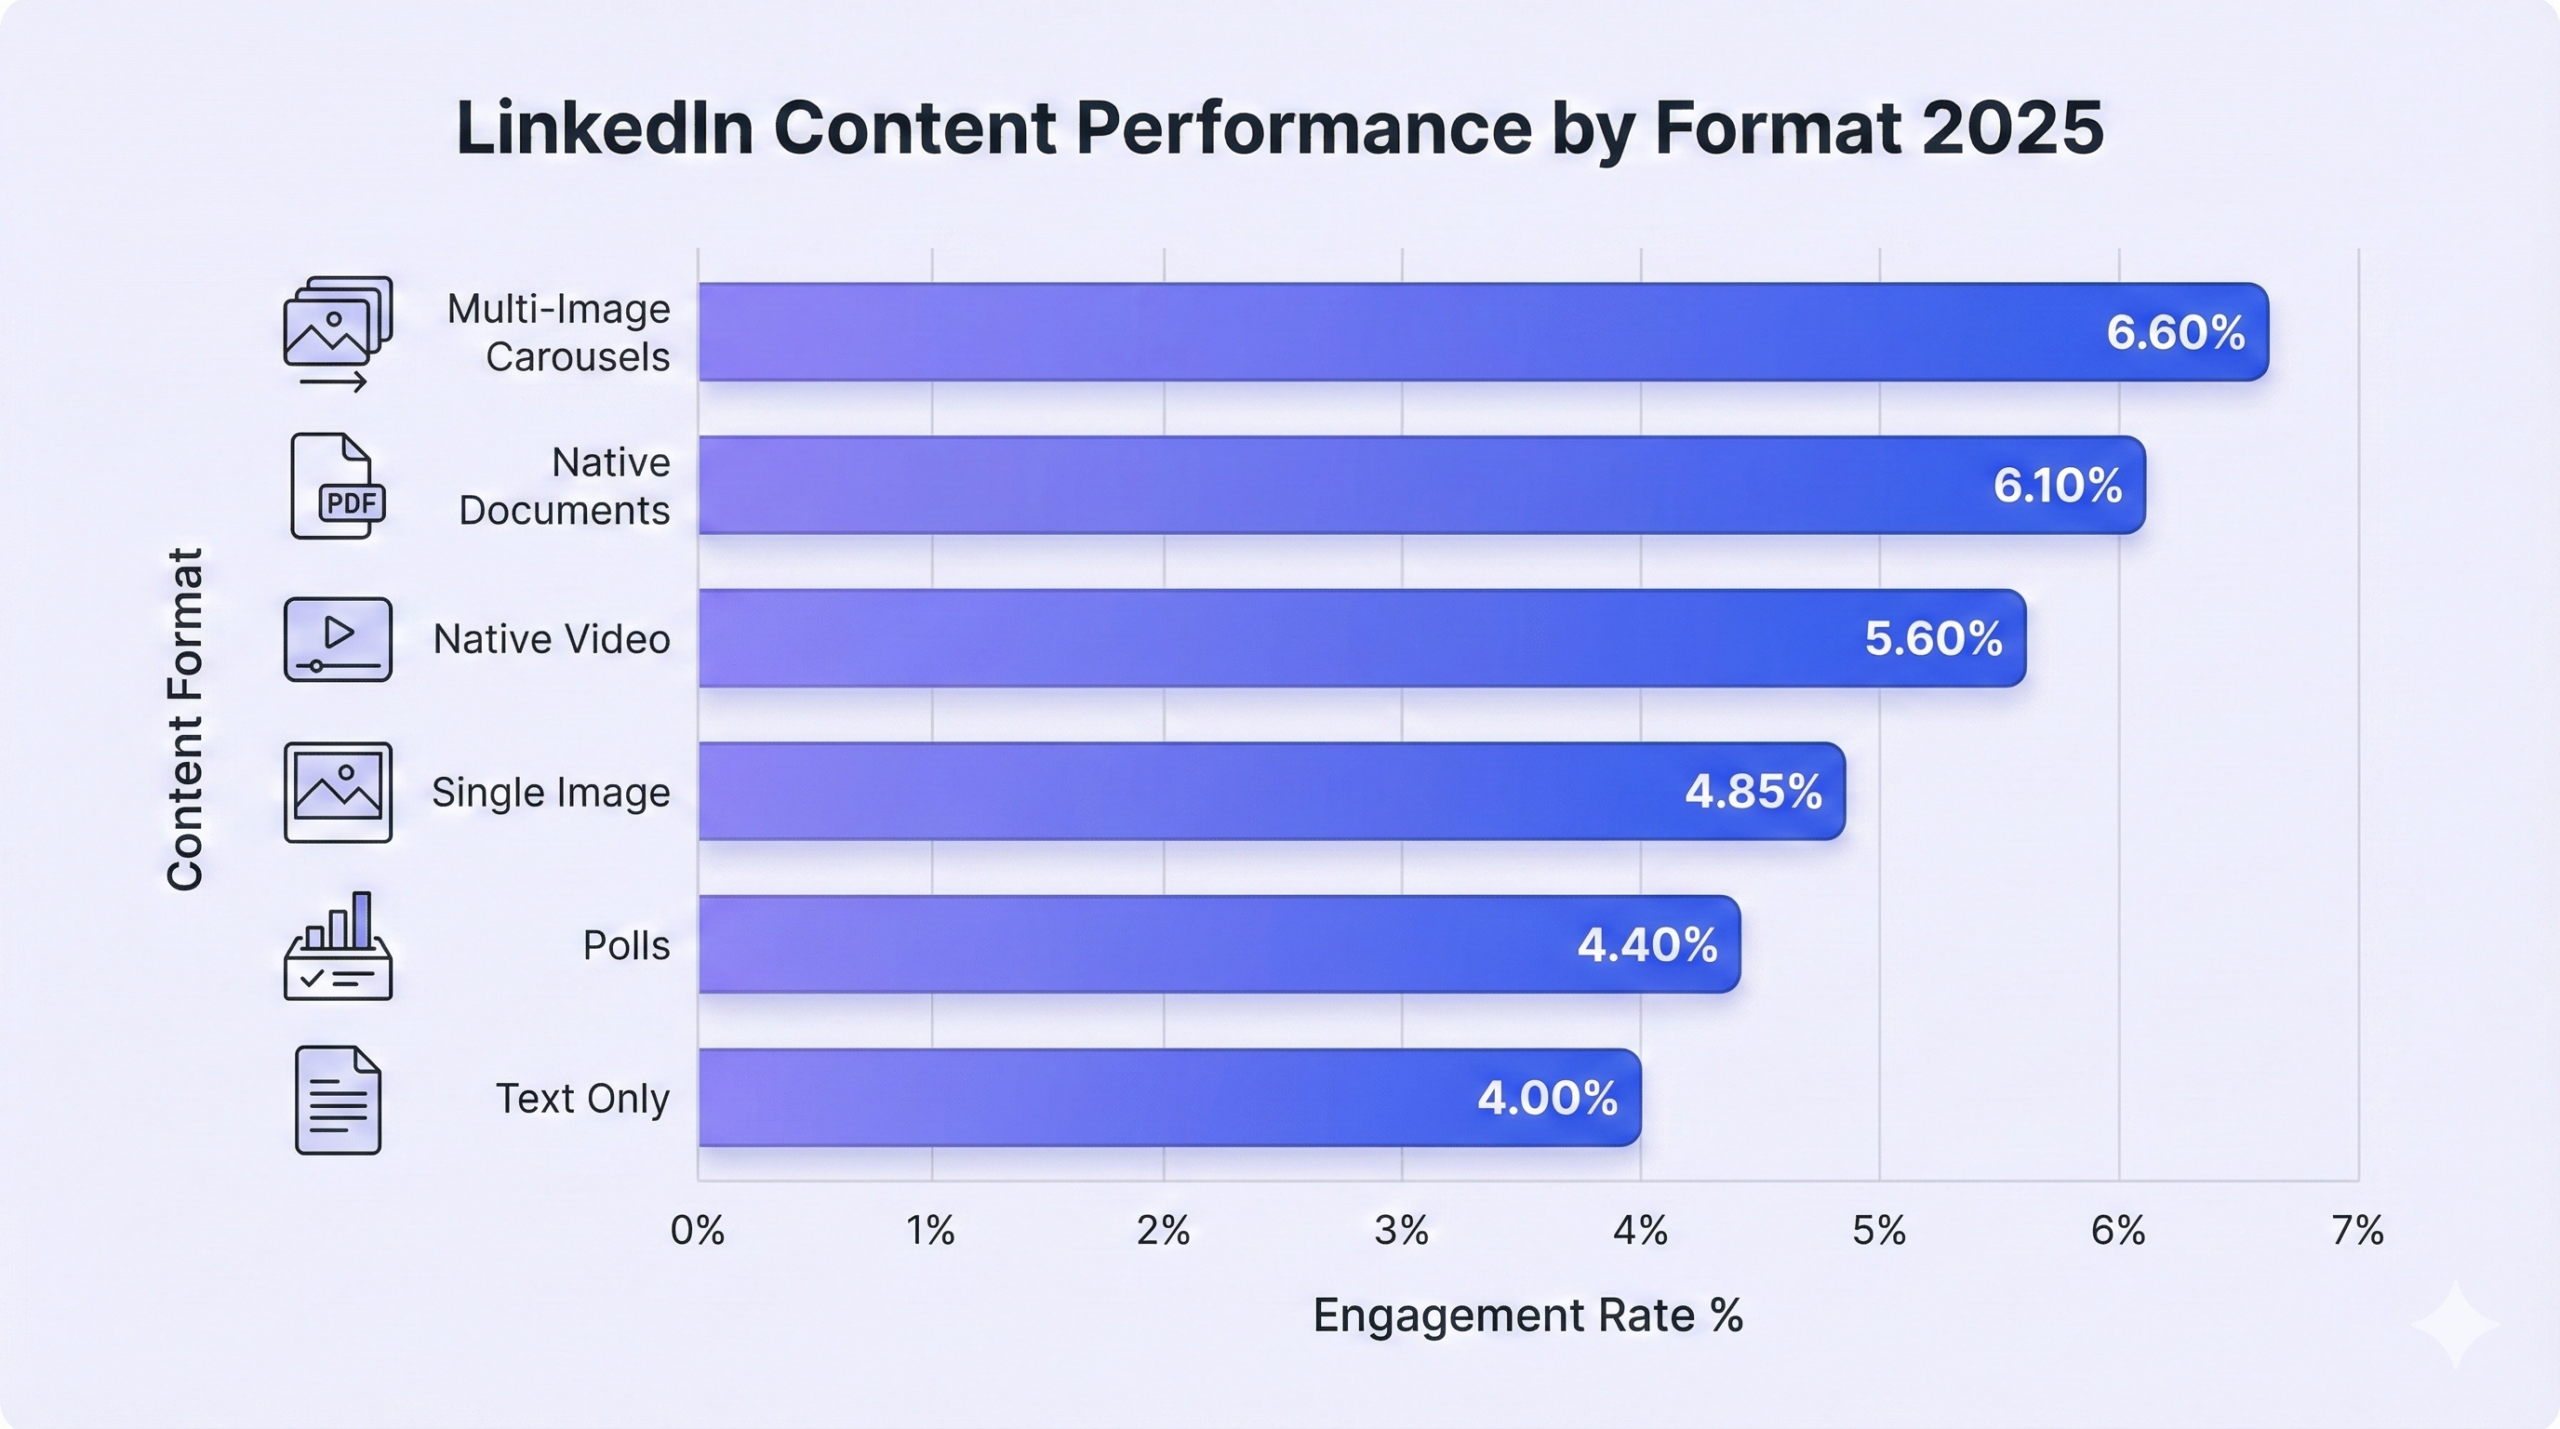
Content Format Performance: What Actually Works
Different content types generate dramatically different results. Here’s the 2025 hierarchy:
Multi-Image Carousels: 6.60% average engagement
The top performer. Users spend time swiping through slides, creating high “dwell time” that the algorithm loves.
Native Documents (PDFs): 6.10% average engagement
Value-dense content people save for later. The “save” action is a massive algorithmic boost.
Native Video: 5.60% average engagement
Trust-building content that’s surged 8% in usage as video becomes essential for professional presence.
Single Image Posts: 4.85% average engagement
The baseline. Solid performance but less interactive than carousels.
Polls: 4.40% average engagement
Generate the most impressions due to low friction, but lower engagement depth.
Text-Only Posts: 4.00% average engagement
The lowest engagement rate, though still valuable for storytelling.
ChatGPT Image Prompt 2: Create a modern horizontal bar chart showing LinkedIn content format performance. Display 6 bars in descending order: Multi-Image Carousels (6.60%), Native Documents (6.10%), Native Video (5.60%), Single Image (4.85%), Polls (4.40%), Text Only (4.00%). Use a purple color (#2A5AF8) for the bars against a light background (#ECECFE). Include percentage labels at the end of each bar in dark text (#1F2124). Add a subtle icon next to each content type. Keep the design clean and business-professional with the title “LinkedIn Content Performance by Format 2025”.
Place after these two lines: “The lowest engagement rate, though still valuable for storytelling.”
Why Carousels and Documents Dominate
The answer lies in dwell time—how many seconds users spend looking at your content.
A text post takes seconds to scan. A 10-slide carousel requires users to stop, read, swipe, read again, and swipe again. This extended interaction signals high value to the algorithm.
Instead of sharing a link to a blog post (which takes people off-platform and hurts reach), repurpose that content into a 5-slide PDF. Upload it natively to LinkedIn. You’ll double your engagement rate while keeping your audience on the platform.
The Video Renaissance
Video has made a massive comeback with performance boosts reaching 69% in specific contexts.
The critical factor: brand or speaker introduction in the first 4 seconds. The algorithm and human attention make go/no-go decisions almost instantly.
Brand pages with over 100,000 followers see up to 2,000 views per video. While this seems modest compared to TikTok, remember these are professional viewers, not random scrollers.
Video humanizes you. It builds trust before any conversation happens. A 45-second video explaining an industry trend creates connection that text never achieves.
The Link Penalty Reality
Does adding a link hurt your reach? Yes, but it’s complex.
Posts with external links get less initial distribution because LinkedIn wants to keep users on the platform. However, the penalty has softened—posts with links now see a modest 5% gain in reach compared to previous years if the caption provides high value.
The workaround: Place links in the first comment instead of the post itself. Or direct users to “Link in bio” to bypass the feed penalty entirely.
Better yet, create posts so compelling that users comment to request the link. This drives comment velocity (boosting the post) and starts direct message conversations.
Posting Strategy: Frequency and Timing
Optimal Posting Frequency
The sweet spot is 2 to 5 times per week. Consistency beats volume. Posting once weekly every week outperforms posting five times one week and zero the next.
Critical rule: Don’t post more than once daily. The algorithm tends to hide your previous post to show your new one. Let each post breathe for 24 hours to maximize reach.
Best Days and Times
Global data points to:
- Best Days: Tuesday, Wednesday, Thursday
- Best Hours: 9:00 AM – 10:00 AM and 12:00 PM
Midweek is when professionals are in wor
k mode but looking for micro-breaks. Monday is for catching up; Friday is for checking out.
The Comment Strategy That Works
Don’t just post. Comment strategically.
For every post you create, comment on five prospects’ posts. Your comment appears in the feeds of everyone connected to that person—free advertising for your profile.
This triggers reciprocity. When you comment on someone’s content, they feel psychologically obligated to check yours out. It’s networking at scale.
Profile Optimization for Search
LinkedIn functions as a search engine. 55% of buyers research vendors on social media before ever taking a meeting.
Your headline shouldn’t just state your title. It should communicate value: “Marketing Director | Helping B2B Companies Scale Through Content Strategy | [Specialization].”
Optimized profiles get consistent inbound views—the highest-quality leads possible because they’re actively searching for your expertise.
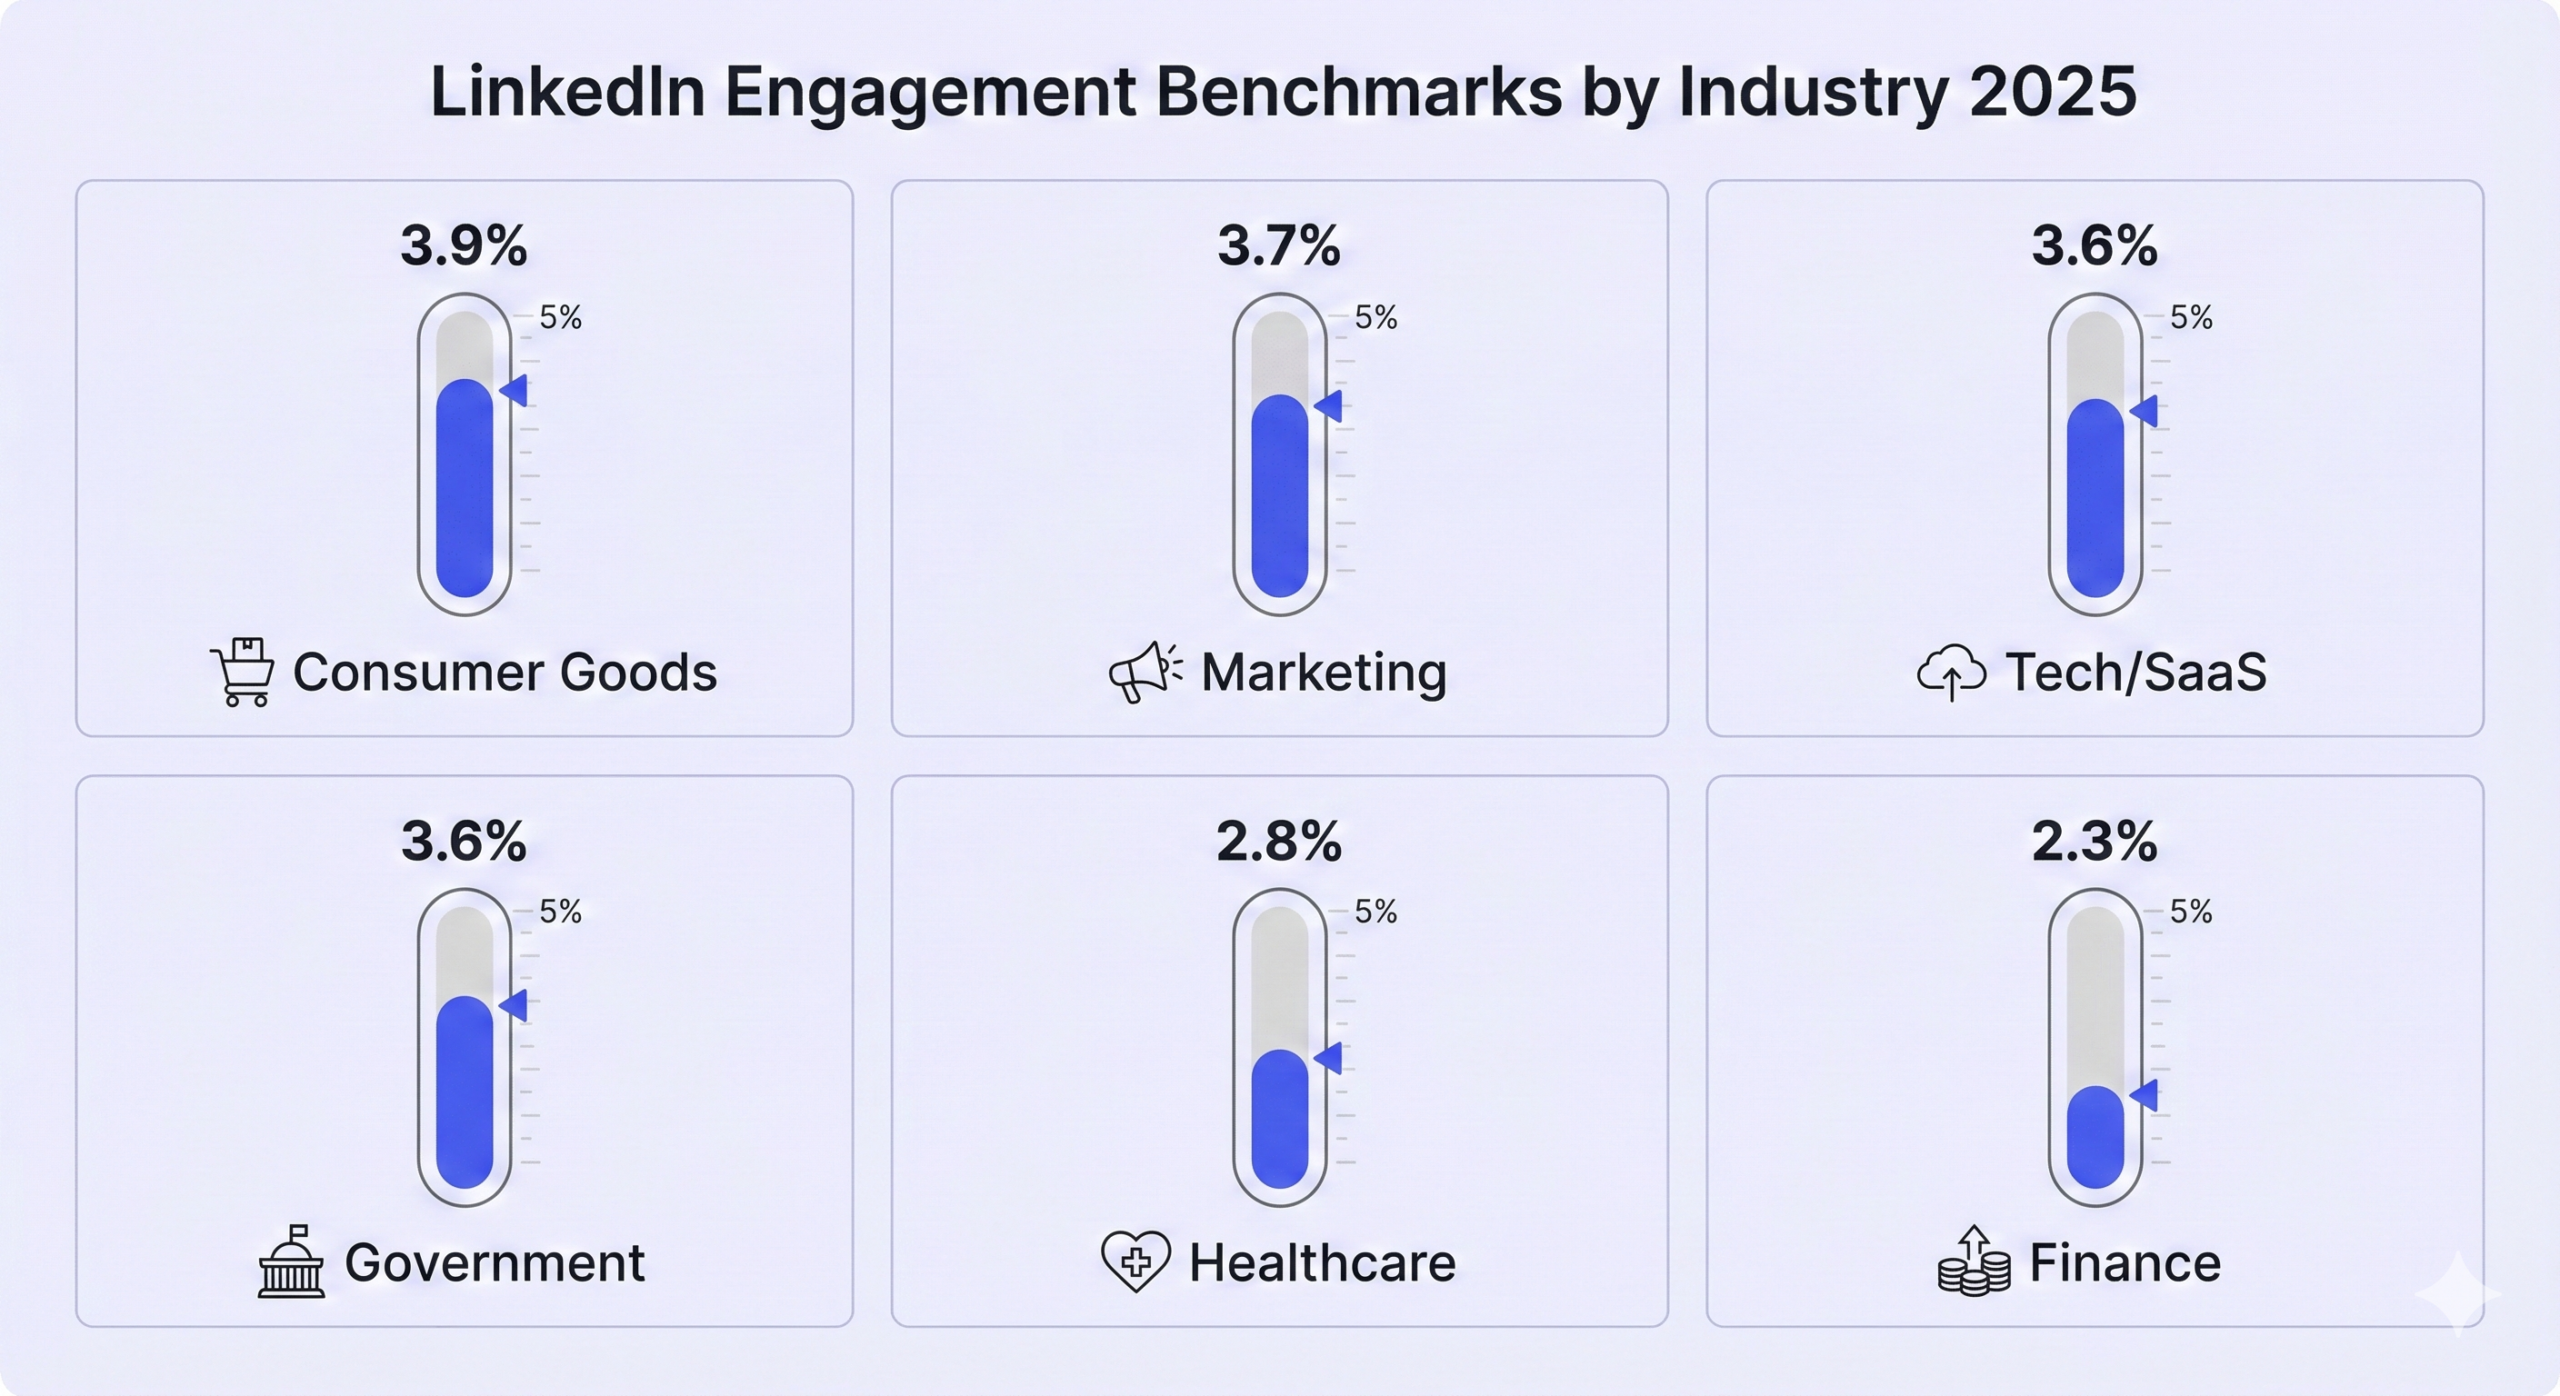
Industry-Specific Benchmarks
The average engagement rate is 5.20%, but your industry determines what “good” looks like:
- Consumer Goods: 3.9% (visual-heavy content, product demonstrations)
- Marketing Agencies: 3.7% (requires deep, tactical insights)
- Tech & SaaS: 3.6% (highly competitive, thought leadership essential)
- Government: 3.6% (informational content, regulatory updates)
- Healthcare: 2.8% (lower due to privacy and compliance concerns)
- Finance: 2.3% (trust-based, conservative content approach)
Context matters. If you’re in tech getting 1% engagement, you need to change your approach. If you’re in finance getting 3%, you’re crushing it.
The Multichannel Advantage
LinkedIn organic reach shouldn’t exist in isolation. The highest-performing professionals combine LinkedIn automation tools with other outreach channels.
Sequences combining LinkedIn, email, and phone see a 287% increase in engagement compared to single-channel approaches.
The strategy: use LinkedIn content for awareness and credibility, then convert through direct outreach. When someone sees your post on Tuesday and receives your personalized message on Wednesday, response rates skyrocket.
This is where LinkedIn prospecting tools become essential—they help you systematically identify, engage, and convert your network into opportunities.
Social Selling Impact on Revenue
The data on business impact is striking:
- Social sellers create 45% more opportunities than non-social sellers
- Exposure to brand content on LinkedIn increases purchase intent by 33%
- Professionals engaged in social selling are 51% more likely to hit quota
For anyone in a revenue-generating role, an inactive LinkedIn profile means leaving nearly half of potential pipeline on the table.
LinkedIn Sales Navigator prospecting takes this further by providing advanced search capabilities and lead recommendations based on your ideal customer profile.
Response Rate Comparisons
Understanding LinkedIn performance requires context against other channels:
- LinkedIn InMail/DM Response Rate: 10-25%
- Traditional Cold Email Response Rate: 5.1%
- Cold Email Open Rate: 27.7% (down from 36% in previous years)
- LinkedIn Message Deliverability: 100% (unless blocked)
- Email Deliverability: 83% (17% hit spam folders)
LinkedIn messages guarantee inbox delivery and generate 2-5x better response rates than email. However, email remains more scalable for volume outreach.
The winning approach combines both: use LinkedIn for high-value prospects requiring relationship building, and cold email software for broader market coverage.
Content Marketing Integration
Your LinkedIn presence should support broader content marketing efforts, not replace them. The platform excels at distribution and discussion, turning blog posts, case studies, and research into conversations.
The engagement statistics show that native content outperforms external links by significant margins. This means repurposing your content marketing specifically for LinkedIn rather than just sharing links.
Turn blog posts into carousel summaries. Transform case studies into short videos. Extract data points from research reports into standalone statistics posts.
For more details on LinkedIn performance metrics across different use cases, see linkedin statistics.

