Let's Build Your First Campaign Together with our LinkedIn Expert

LinkedIn Statistics 2026: Key Data & Trends

Table of Contents

LinkedIn Statistics 

  • 1.2 billion registered members reached October 2025 (20.7% of global adult population) – three new professionals joining every second, but only 310-350 million monthly active users where real action happens
  • Monthly growth 5.18-7.78 million new members – showing no signs of slowing despite market saturation in mature regions, establishing LinkedIn as continuously expanding professional network
  • United States: 243 million users, Asia-Pacific: 343 million (largest regional block) – India 161 million (second-largest market), Brazil 89 million, China 58 million, UK 45 million rounding top five
  • Millennials (25-34) dominate at 47.3-50.6%, Gen Z (18-24) fastest-growing at 24.5-28.7% – Gen Z treating LinkedIn like TikTok prioritizing video, personal branding, authentic storytelling over traditional corporate posts
  • 53% of U.S. users from $100K+ households with 65 million decision-makers, 10 million C-level – most concentrated source of buying power on social media making it B2B goldmine
  • Average session 14 minutes 20 seconds – focused professionals looking for business intelligence, networking opportunities, or career advancement unlike entertainment platform engagement
  • Mobile 57% of traffic but desktop 74% of visits – “lean-back vs lean-in” behavior revealing people consume content on mobile, switch to desktop for serious work like recruiting and prospecting
  • Only 1% post content weekly yet generating 9 billion impressions per week – creating content consistently puts you in top 1% with massive organic reach compared to other platforms
  • Posts with 5+ comments in first hour 3.1x more likely to trend – 60% of total reach happening in first 90 minutes making strategic posting times critical for visibility
  • Carousels 6.6% engagement, Documents 6.1%, Native video 5.6%, Images 3.4-4.0% – video uploads up 34% YoY with native videos getting 5x more engagement than external YouTube/Vimeo links
  • Live video generating 24x more engagement than pre-recorded content – real-time nature creating urgency and community interaction algorithm heavily rewards, 73% of views on mobile
  • 80% of B2B leads from social media come from LinkedIn – platform 277% more effective for lead generation than Facebook, dominating business audience targeting
  • Lead Gen Forms: 13% conversion vs external landing pages 2.35% – nearly 80% drop in conversions from friction of leaving platform, keep conversion events on LinkedIn whenever possible
  • InMail: 18-25% response rate vs cold email 1-5% – InMail open rate 50-85% vs email 27.7%, giving 4-5x performance advantage through closed ecosystem and platform trust
  • Connection limits: ~100 requests/week safe, 500+ pending = red flag – no note 31% acceptance, generic pitch 29%, hyper-personalized 60-70%+, exceeding limits triggers “LinkedIn Jail”

LinkedIn isn’t just another social network anymore—it’s become the operating system of the global economy. Whether you’re trying to land your dream job, close B2B deals, or build your professional brand, understanding the numbers behind this platform is critical.

In this guide, we’re breaking down the most important LinkedIn statistics for 2025 that actually matter to your success. No fluff, just the data you need to make smarter decisions about your presence on the platform.

Let’s dive in.

LinkedIn Statistics 2026

User Growth: The 1.2 Billion Milestone

LinkedIn officially crossed 1.2 billion registered members in October 2025. That’s roughly 20.7% of the entire global adult population on one platform. Every single second, three new professionals join the network.

But here’s the reality check: not all those accounts are active. The platform has between 310 million and 350 million monthly active users. That’s where the real action happens—these are the people scrolling, engaging, and making decisions.

Monthly growth sits between 5.18 million and 7.78 million new members, showing no signs of slowing down despite market saturation in mature regions.

Geographic Breakdown: Where the Users Are

The United States remains the heavyweight with 243 million users, but Asia-Pacific has taken the crown as the largest regional block with 343 million members. India alone accounts for 161 million users, making it the second-largest market globally.

Brazil follows with 89 million users, while China has 58 million and the UK rounds out the top five with 45 million.

Interestingly, some micro-markets show saturation rates exceeding 100% of their populations. The UAE hits 102.8%, the Cayman Islands reach 115.6%, and Bermuda clocks in at 111.6%. This happens because of expat workforces, multiple business accounts, and high concentrations of international corporations.

[RIGHT SIDE STICKY BANNER]

H1: 🚀 Tired of Low Response Rates?

H2: Get 15-25% reply rates with LinkedIn outbound—complete targeting, campaigns, and scaling done for you

CTA: Book Strategy Meeting

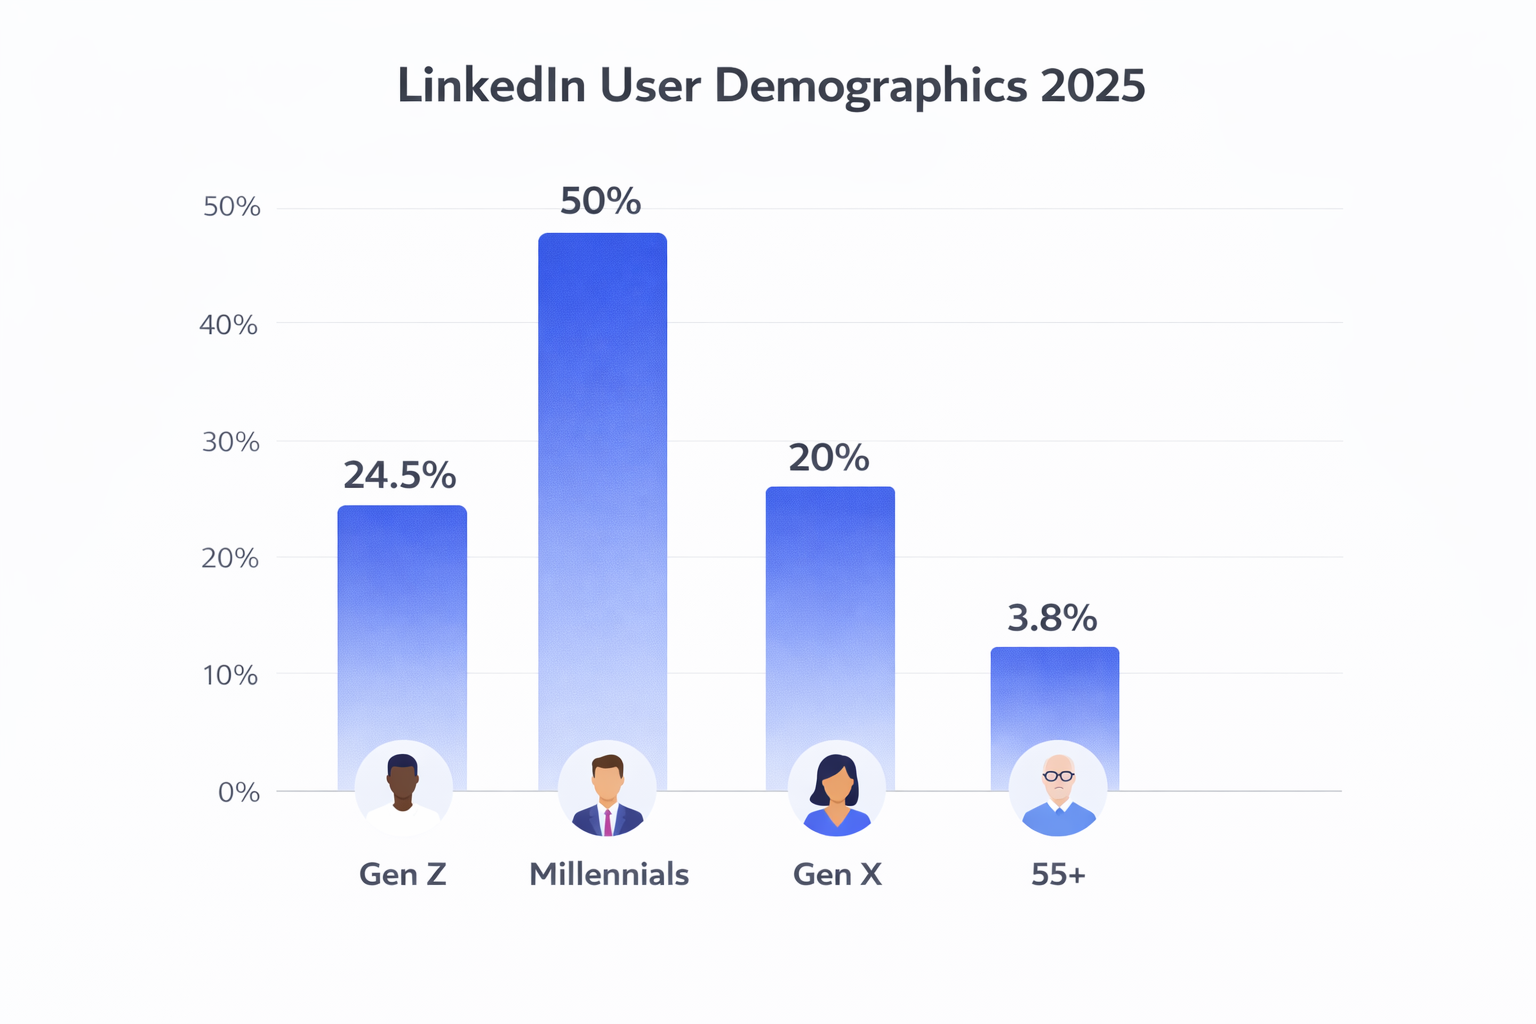
Demographics: The Platform is Getting Younger

Forget the stereotype of LinkedIn being a stuffy executive network. Millennials (ages 25-34) dominate the platform, making up between 47.3% and 50.6% of all linkedin users. They’re now in management roles, controlling budgets and hiring decisions.

Generation Z (ages 18-24) is the fastest-growing segment at 24.5% to 28.7% of the user base. They treat LinkedIn like TikTok—prioritizing video content, personal branding, and authentic storytelling over traditional corporate posts.

Users over 55 represent only 3.3% to 3.8% of the platform, but don’t underestimate them. This age group holds the majority of C-suite positions and controls massive purchasing power.

Income and Education:

  • 53% of U.S. users come from households earning over $100,000 annually
  • 33% hold a bachelor’s degree
  • 18% have a master’s degree or higher

The platform hosts 65 million business decision-makers and 10 million C-level executives, making it the most concentrated source of buying power on social media.


Engagement: How People Actually Use LinkedIn

The average user spends 14 minutes and 20 seconds per session on LinkedIn. That might sound low compared to entertainment platforms, but the intent is completely different—these are focused professionals looking for business intelligence, networking opportunities, or career advancement.

Mobile accounts for 57% of traffic, but desktop still drives nearly 74% of visits in some metrics. This split reveals a “lean-back vs. lean-in” behavior: people consume content on mobile but switch to desktop for serious work like recruiting, prospecting, and messaging.

 📊 Statistics Show Email is Dying

LinkedIn outbound delivers 4-5x better response rates than cold email—without deliverability headaches

Place after: “This split reveals a “lean-back vs. lean-in” behavior: people consume content on mobile but switch to desktop for serious work like recruiting, prospecting, and messaging.”

Here’s a shocking stat: only 1% of users post content weekly, yet this tiny minority generates 9 billion impressions per week. If you’re creating content consistently, you’re already in the top 1%—and the organic reach is still massive compared to other platforms.

When it comes to engagement, timing matters. Posts that get 5+ comments in the first hour are 3.1x more likely to trend. Plus, 60% of a post’s total reach happens in the first 90 minutes, which makes strategic posting times critical.

Content Performance: What Actually Works in 2025

Not all content formats are created equal on LinkedIn. The algorithm has clear preferences that keep users on the platform longer.

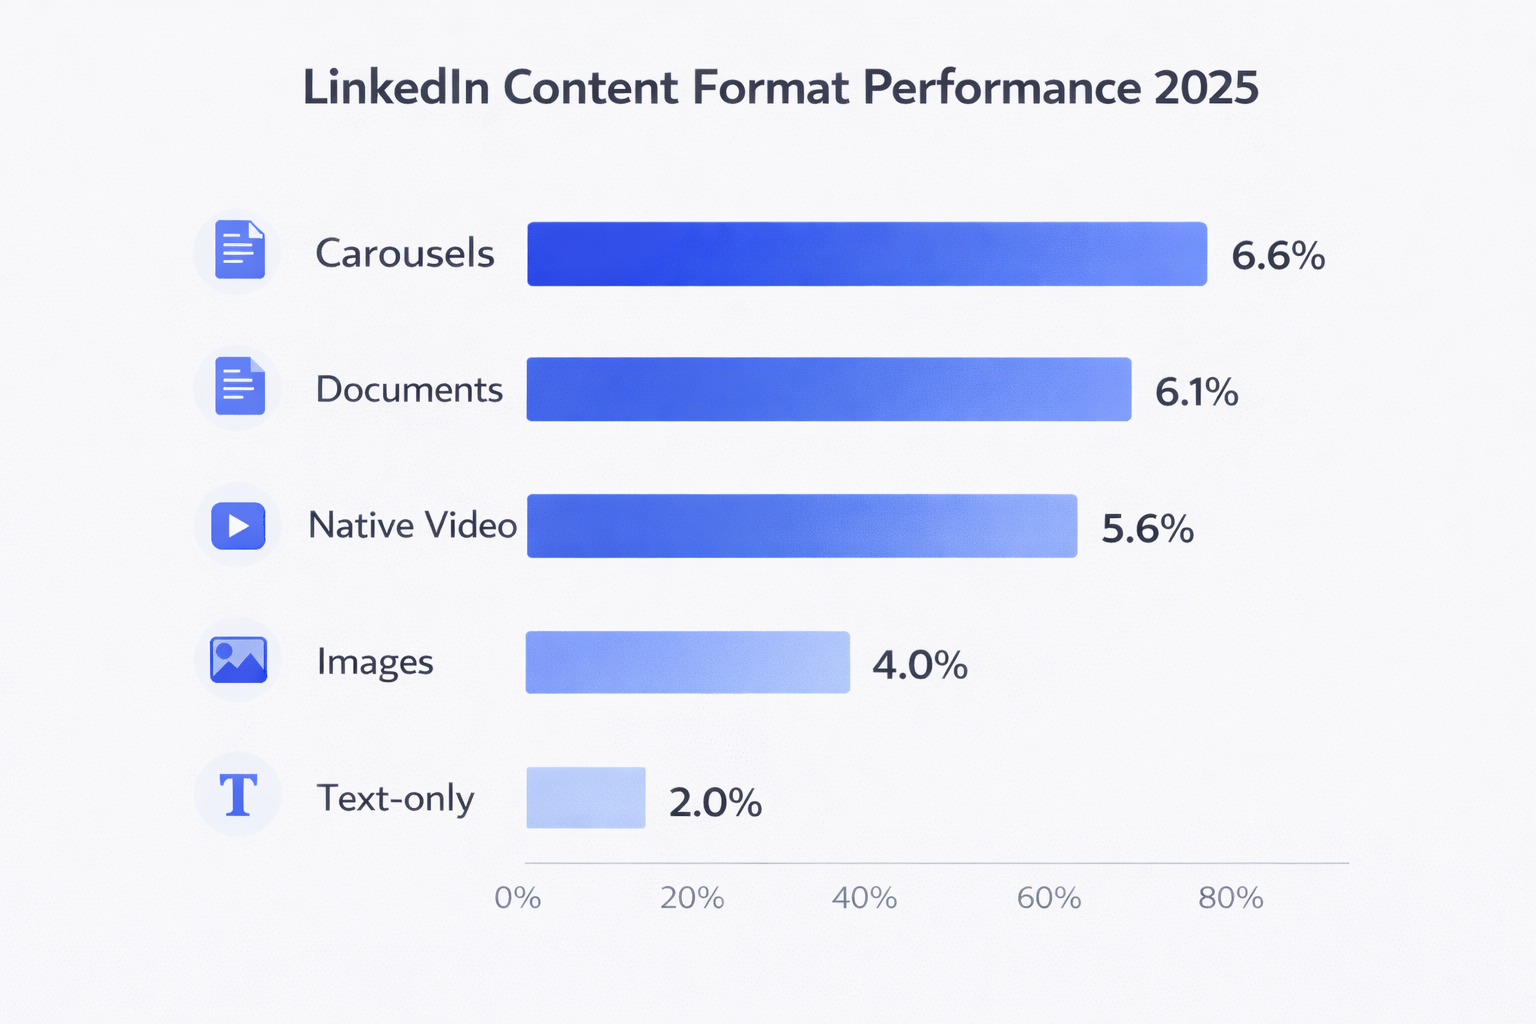
Content Performance Hierarchy:

  • Carousels (PDFs): 6.6% average engagement rate—the top performer
  • Document posts: 6.1% average engagement rate
  • Native video: 5.6% average engagement (up 40% year-over-year)
  • Images: 3.4-4.0% average engagement (receive 2x more comments than text)
  • Text-only: Lowest engagement overall

Video is exploding on LinkedIn. Uploads have increased 34% year-over-year, and native videos (uploaded directly) get 5x more engagement than external YouTube or Vimeo links.

Live video takes it further—generating 24x more engagement than pre-recorded content. The real-time nature creates urgency and community interaction that the algorithm heavily rewards.

With 73% of video views happening on mobile, format matters. Square or vertical videos perform 2.1x better than landscape because they occupy more screen real estate. And captions aren’t optional—videos with captions keep viewers watching 32% longer.


Posting Frequency: How Often Should You Post?

The relationship between posting frequency and performance isn’t linear. Here’s what the data shows:

Posting 2-5 times per week is the sweet spot for most professionals and brands. This frequency signals to the algorithm that you’re an active participant without causing audience fatigue.

Accounts that post 6-10 times weekly see an additional 5,001 impressions per post, but the resource investment is steep. For most people, consistency at 2-5 posts weekly beats burning out at higher volumes.

The key takeaway: moving from once a week to 2-5 times weekly acts like an algorithmic “switch,” significantly boosting your distribution per post.

⚡ Your Posting Strategy Needs This

 Our LinkedIn outbound system handles targeting, campaigns, and scaling—so you get meetings, not guesswork

Place after: “The key takeaway: moving from once a week to 2-5 times weekly acts like an algorithmic “switch,” significantly boosting your distribution per post.”

B2B Marketing: The Lead Generation Machine

LinkedIn absolutely dominates B2B marketing. The platform is responsible for 80% of all B2B leads generated from social media—no other channel comes close.

70% of marketers report positive ROI from LinkedIn ads, and studies show it’s 277% more effective for lead generation than Facebook when targeting business audiences. Many professionals are moving away from traditional outreach tools to focus on LinkedIn’s superior targeting capabilities.

Lead Generation Forms vs. Landing Pages:

This is where things get interesting. LinkedIn’s native Lead Gen Forms (which auto-fill with profile data) achieve an average conversion rate of 13%. External landing pages only convert at 2.35%.

That’s nearly an 80% drop in conversions just from the friction of leaving the platform. The lesson is clear: keep your conversion events on LinkedIn whenever possible.

💰 Stop Losing 80% of Your Leads

LinkedIn outbound eliminates friction—our complete system books meetings directly without landing page drop-off

Advertising Costs and Performance

LinkedIn ads cost more than other platforms, but you’re paying for quality, not just eyeballs. The average Cost Per Click (CPC) is $5.58, with the global Click-Through Rate (CTR) ranging from 0.44% to 0.65%.

Industry breakdown:

  • Technology/SaaS: 0.75-1.25% CTR, $7.90 CPC
  • Finance: 0.60% CTR, $6.90 CPC
  • Education: 1.0-1.5% CTR, $4.90 CPC
  • Healthcare: 1.25-1.75% CTR

Targeting senior decision-makers costs even more. The CPC for C-suite executives averages $6.40 compared to $4.40 for junior employees. But when you’re reaching the 10 million C-level executives on the platform, that premium is often worth it.

Sales and Social Selling: The Numbers Don’t Lie

“Social selling”—using LinkedIn to find, connect with, and nurture prospects—has become a hard performance metric, not just a buzzword.

Sales leaders who actively use social selling are 51% more likely to reach their quota compared to peers who don’t. High Social Selling Index (SSI) scores correlate with 45% more sales opportunities.

The practice is now mainstream: 71% of sales professionals and 90% of top performers use social selling tools like Sales Navigator.


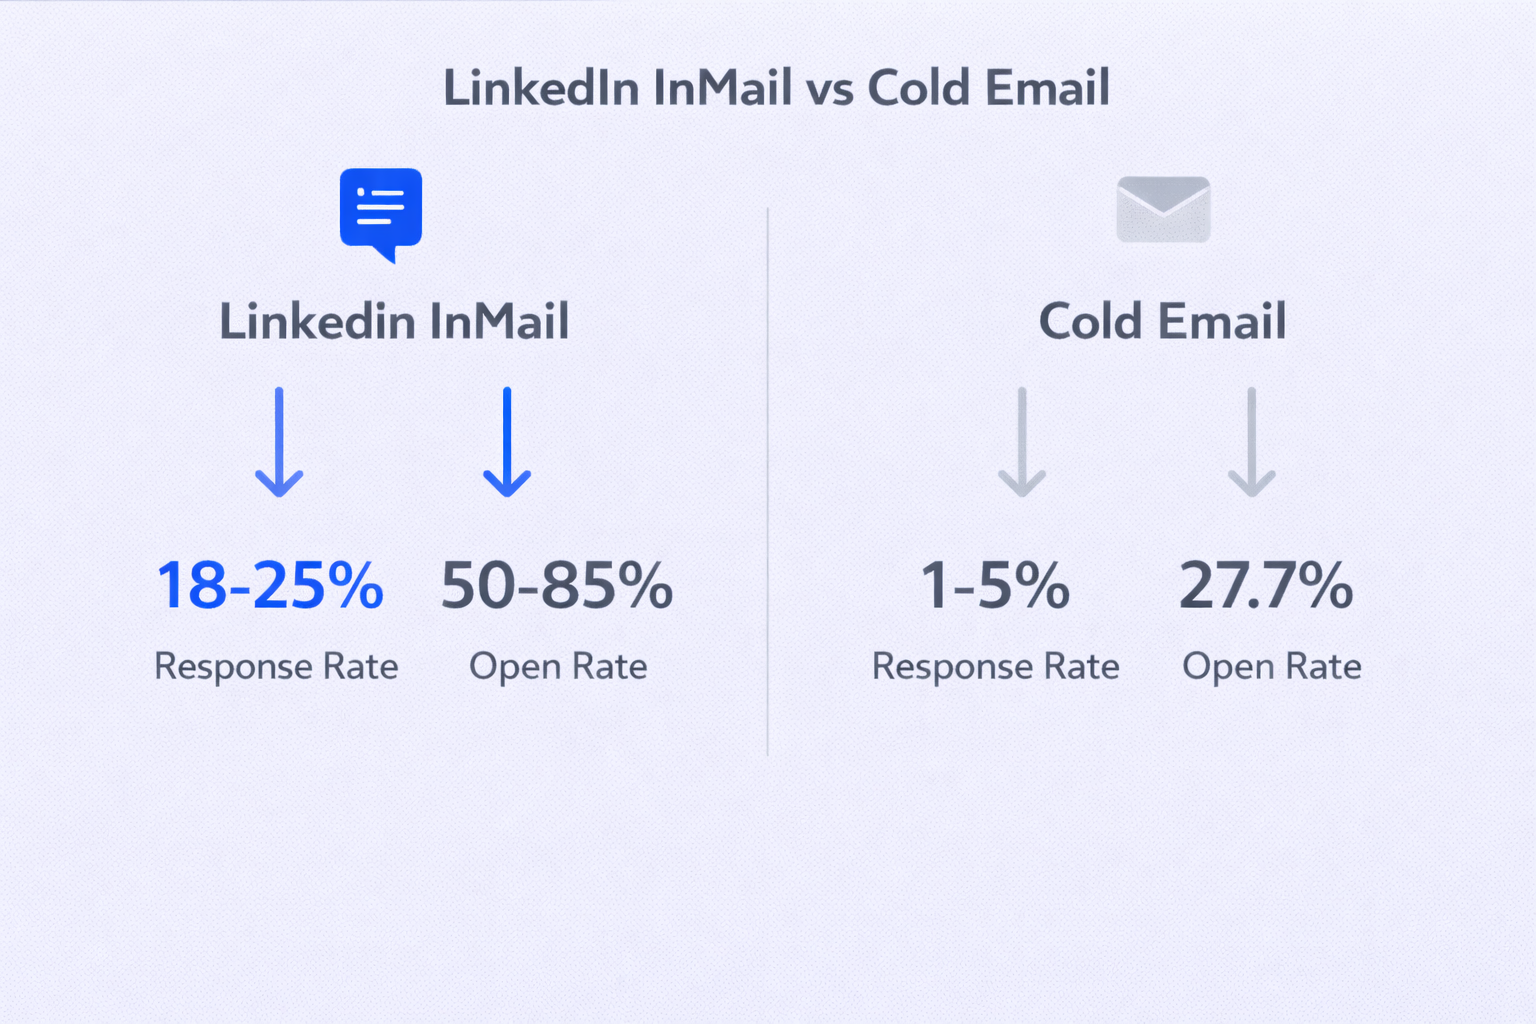
InMail vs. Cold Email:

LinkedIn InMail crushes traditional cold email:

  • InMail response rate: 18-25%
  • Cold email response rate: 1-5%
  • InMail open rate: 50-85%
  • Cold email open rate: 27.7%

The closed ecosystem, profile visibility, and platform trust give InMail a 4-5x performance advantage over email. Smart sales teams use a hybrid approach: warm up prospects with LinkedIn engagement, then follow up via InMail or email.

🎯 4-5x Better Than Cold Email

Our LinkedIn outbound engine delivers systematic 15-25% response rates with complete campaign management

7-day Free Trial |No Credit Card Needed.

Connection Request Strategy: Navigate the New Limits

LinkedIn has cracked down hard on automation and bulk outreach. Most users face a weekly limit of approximately 100 connection requests. Exceeding this triggers temporary restrictions commonly called “LinkedIn Jail.”

Having more than 500 pending (unaccepted) connection requests is a red flag that signals spammy behavior to the algorithm.

Should you add a note to your connection request? The data might surprise you:

  • No note: 31% acceptance rate
  • Generic sales pitch note: 29% acceptance rate
  • Hyper-personalized note: 60-70%+ acceptance rate

The lesson: if you can’t personalize deeply (referencing a specific post, shared connection, or genuine common ground), send no note. Generic notes actually hurt your acceptance rate.

When doing advanced LinkedIn outreach, quality always beats quantity.

Recruitment: Hiring at Lightning Speed

Every minute, 7 hires are made directly through LinkedIn. The platform has become the default hiring infrastructure for professional roles.

AI in Recruiting:

37% of organizations now integrate generative AI into their hiring workflows. Recruiters using these tools save nearly 20% of their workweek—effectively reclaiming a full day for strategic work.

Over 100 million members have added verification badges to their profiles, combating resume fraud and bot accounts. Unverified profiles may soon face visibility penalties in recruiter searches.

Skills-Based Hiring:

The traditional “paper ceiling” is cracking. There’s been a 16% increase in job posts that don’t require a degree since 2020. In 2025, 26% of paid job posts no longer list a degree as mandatory.

Job postings are now 54x more likely to list “relationship development” as a required skill. As AI automates technical tasks, human-centric abilities—negotiation, empathy, conflict resolution—have become premium currency.

Since 2016, profiles adding AI skills have grown 20x. AI literacy is now expected across marketing, sales, HR, and leadership roles—not just technical positions.

Top 5 In-Demand Skills for 2025:

  1. AI Literacy
  2. Conflict Mitigation
  3. Adaptability
  4. Process Optimization
  5. Solution-Based Selling

Professionals looking to stay competitive should focus on LinkedIn profile optimization to highlight these emerging skills.

Platform Revenue and Infrastructure

LinkedIn generated $17.81 billion in revenue for fiscal year 2025—a 9% year-over-year increase. Unlike ad-dependent platforms, LinkedIn’s revenue is diversified across Talent Solutions (recruiting), Marketing Solutions (ads), Sales Solutions (Sales Navigator), and Premium Subscriptions.

AI is now the core infrastructure of LinkedIn:

  • Feed curation: AI determines which posts trend in the first 90 minutes
  • Content creation: Generative AI tools help write posts, headlines, and ad copy
  • Job matching: AI algorithms power the “7 hires per minute” statistic
  • Search: Natural language queries like “Find me a marketing manager in Austin who knows Python” are now possible

The platform’s push toward Premium features (like Hiring Assistant and Premium Company Pages) creates a tiered experience where paying users gain distinct visibility advantages.

For professionals serious about leveraging LinkedIn automation ethically and effectively, understanding these infrastructure changes is critical.

Conclusion

LinkedIn in 2025 isn’t the passive resume repository it once was. With 1.2 billion members, 310-350 million active users, and dominance in B2B lead generation, it’s the most powerful professional network on Earth.

The numbers are clear: 80% of B2B leads come from LinkedIn, InMail gets 4-5x better response rates than cold email, and native video content is up 40% year-over-year. Whether you’re recruiting, selling, marketing, or building your personal brand, ignoring these statistics means leaving opportunity on the table.

The platform rewards precision, consistency, and authentic engagement while punishing spam and generic content. Master the mechanics, respect the limits, and use the data to guide your strategy.

Looking to leverage these insights for actual business results? Our LinkedIn outbound services help you turn statistics into systematic meetings with decision-makers.

FAQs

How many active users does LinkedIn have in 2025?

LinkedIn has between 310 million and 350 million monthly active users out of 1.2 billion total registered members. The active user base represents professionals who regularly engage with content, apply for jobs, and respond to outreach.

What is the best posting frequency on LinkedIn?

2-5 posts per week is the optimal range for most professionals and brands. This frequency maintains algorithmic favor without causing audience fatigue. Posting 6-10 times weekly yields additional reach but requires significant resources.

How much do LinkedIn ads cost?

The average Cost Per Click (CPC) is $5.58, with industry variations from $4.90 (education) to $7.90 (technology/SaaS). Targeting senior decision-makers costs more at $6.40 per click versus $4.40 for junior employees.

What content performs best on LinkedIn in 2025?

Carousels (6.6%) and document posts (6.1%) deliver the highest engagement rates, followed by native video (5.6%). Videos with captions perform 32% better, and live video generates 24x more engagement than pre-recorded content.

How can I increase my LinkedIn connection acceptance rate?

Either send no note (31% acceptance) or a hyper-personalized note (60-70%+ acceptance). Generic sales pitch notes actually decrease acceptance to 29%. Always reference specific posts or shared interests when personalizing.

What to Build a High-Converting B2B Sales Funnel from Scratch on LinkedIn

Build a Full LinkedIn Pipeline in Just 30 Days—Guaranteed