

You closed three major deals this quarter, hit 120% of quota, and felt unstoppable. Then next quarter arrives, and your pipeline looks thinner than yesterday’s coffee. What happened? The silent killer of SaaS growth struck again: customer churn.
While you’re out there prospecting new leads and perfecting your pitch deck, existing customers are quietly walking out the back door. Each churned customer doesn’t just represent lost revenue—it inflates your future quota, makes growth exponentially harder, and turns your sales team into hamsters on a wheel, running faster just to stay in the same place.
The SaaS industry has matured dramatically, and the companies winning today aren’t just good at acquiring customers—they’re masters at keeping them. Understanding churn statistics isn’t just nice-to-know data for executives in boardrooms. It’s mission-critical intelligence that directly impacts your sales strategy, compensation, and career trajectory.
This isn’t another article filled with vanity metrics. These are the 10 most crucial SaaS churn statistics for 2025, translated into what they actually mean for your sales process, deal qualification, and long-term success.
How We Collected This Data
The statistics and insights presented here come from the most authoritative sources in the SaaS industry. We’ve analyzed data from Recurly’s 2025 Churn Report, ProfitWell by Paddle’s subscription metrics, ChartMogul’s SaaS benchmarking studies, Baremetrics retention analytics, and Benchmarkit’s industry surveys.
This isn’t opinion-based content. Every statistic has been cross-referenced across multiple sources to ensure accuracy and relevance. The data represents real SaaS companies ranging from early-stage startups to enterprise-level organizations, giving you benchmarks that actually matter for your business context.
10 SaaS Churn Statistics You Should Know
The Industry Baseline: Average B2B SaaS Churn Rate is 3.5% Annually
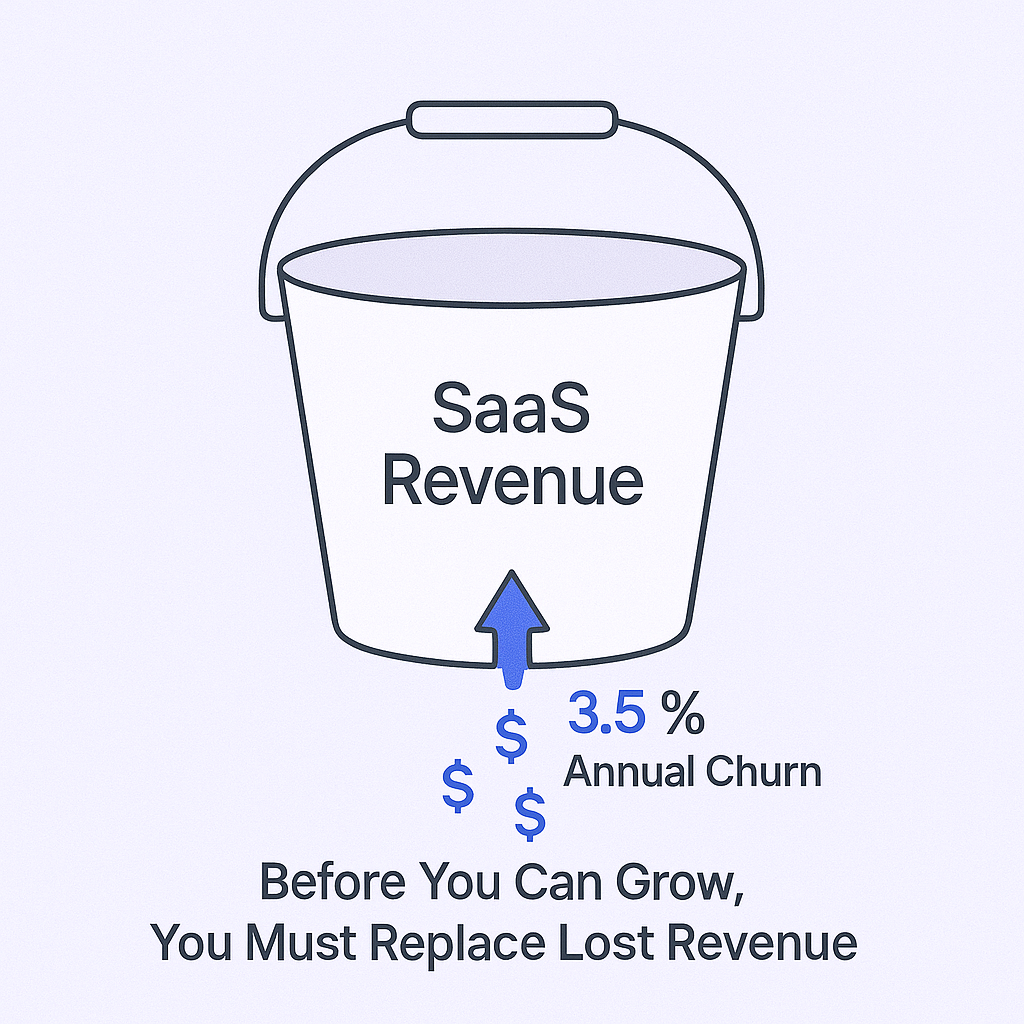
The median annual churn rate for B2B SaaS companies sits at 3.5%, according to Recurly’s comprehensive 2025 analysis. Companies maintaining churn below 5% annually are considered to be on solid ground, while anything above 7% signals serious underlying problems that need immediate attention.
This 3.5% represents more than just a benchmark—it’s the baseline “leak” in your revenue bucket. Before your company can achieve any net growth, it must first replace this 3.5% of recurring revenue that walks out the door each year. Your sales quota isn’t just designed around growth targets; it’s inflated to compensate for this inevitable revenue loss.
Here’s the harsh reality: if your company’s churn rate exceeds the industry average, your quota becomes artificially inflated. You’re not just selling to grow the business—you’re selling to replace lost revenue before you can even think about expansion.
The correlation is direct: higher churn creates higher sales pressure, which often leads to desperate prospecting and poor-fit customer acquisition, which creates even higher churn. It’s a vicious cycle that traps sales teams in perpetual firefighting mode.
The Financial Multiplier: 5% Retention Boost Increases Profits by Up to 95%
This statistic, originally from Bain & Company research, remains one of the most impactful in subscription businesses. A seemingly small 5% improvement in customer retention can boost company profitability by 25% to 95%. The math is simple but powerful: retaining existing customers costs up to 5 times less than acquiring new ones, and existing customers typically spend 67% more than new acquisitions.
Profitable companies invest more in sales enablement, provide higher-quality marketing support, maintain better commission structures, and create more stable working environments. When churn erodes profitability, the first casualties are often sales support systems, lead quality, and compensation plans.
This data justifies a fundamental shift in sales methodology: quality over quantity becomes not just a nice-to-have philosophy, but a business imperative. One perfectly-matched customer who stays for three years contributes more to company health than five poor-fit customers who churn within months.
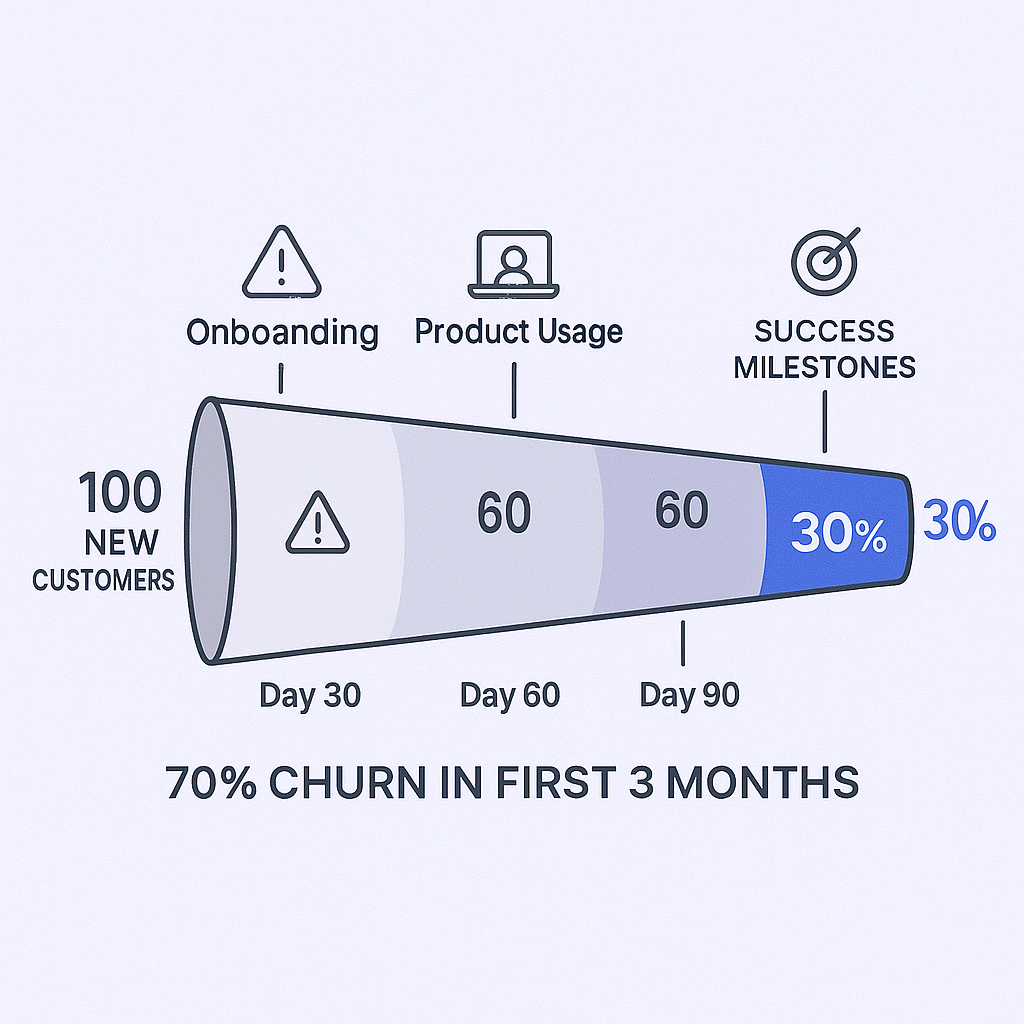
The Early Warning: 70% of New Users Churn Within First 3 Months
Perhaps the most sobering statistic in SaaS: 70% of new users are lost within the first 90 days. This rapid attrition almost always stems from failed onboarding experiences or fundamental mismatches between sales promises and product reality.
This statistic has spawned the rise of “clawback” clauses in sales compensation. If your newly-signed customer churns within 90-180 days, you might be required to return the commission you earned. Suddenly, your job extends far beyond contract signatures—you’re financially responsible for customer success during those crucial first months.
Closing a bad-fit customer might boost your monthly numbers temporarily, but it’s a strategic loss. These customers drain support resources, generate negative reviews that deter future prospects, and are most likely to trigger commission clawbacks.
The Value Connection: Churn Varies Dramatically by Customer Size
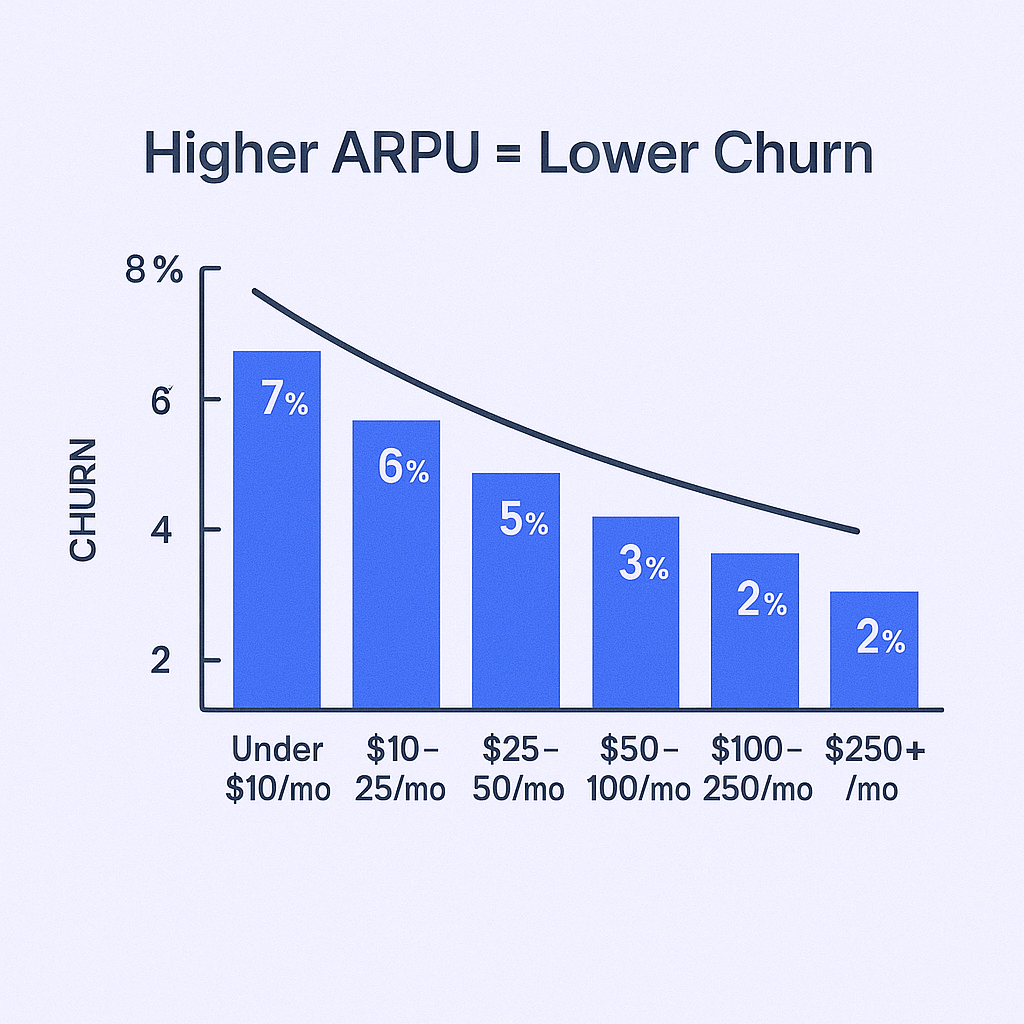
Churn isn’t an equal-opportunity problem. Companies with higher Average Revenue Per User (ARPU) experience significantly lower churn rates. Customers paying under $50 monthly can see churn rates between 6-8.6%, while those paying over $250 monthly demonstrate much stronger retention patterns.
Similarly, enterprise customers churn at annual rates of just 1-2%, while small businesses typically churn at 3-5% annually. The reasons are logical: larger customers have higher switching costs, deeper product integrations, and broader organizational buy-in that makes changing solutions complex and painful.
ARPU Range | Monthly Churn Rate | Monthly Revenue Churn |
Under $10 | 6.2% | 6.7% |
$10-$25 | 6.6% | 6.9% |
$25-$50 | 7.3% | 8.6% |
$50-$100 | 6.3% | 7.3% |
$100-$250 | 7.1% | 7.8% |
Over $250 | 5.0% | 6.5% |
This data provides clear strategic direction: focus upmarket whenever possible. Larger deals aren’t just more lucrative initially—they’re fundamentally more stable and predictable over time.
The Growth Metric: Top Companies Exceed 120% Net Revenue Retention
Elite SaaS companies have discovered the secret to sustainable growth: expanding existing customer relationships. While median Net Revenue Retention (NRR) for SaaS companies hovers around 102-106%, top-quartile performers exceed 120% NRR.
NRR above 100% means revenue growth from existing customers (through upsells, cross-sells, and expansion) exceeds revenue lost from churn and downgrades. This “negative churn” state represents the holy grail of SaaS business models.
For sales professionals, this signals a fundamental shift in role definition. Your biggest opportunities may not be new logos, but rather the existing customer base. Modern sales compensation increasingly blends new business quotas with expansion revenue targets, reflecting this strategic shift.
The initial sale becomes a forecast for future expansion potential. During discovery calls, ask forward-looking questions: “What are your team’s growth plans for next year?” or “If this implementation succeeds, which other departments could benefit?” You’re not just qualifying the current deal—you’re identifying future expansion opportunities.
The Hidden Leak: 0.8% Churn from Failed Payments Costs 8.6% Revenue
Not all churn reflects customer dissatisfaction. Involuntary churn from expired credit cards, failed payments, and billing issues accounts for approximately 0.8% of B2B SaaS churn, though some studies suggest it can reach 20-40% of total churn.
While seemingly small, fixing this “accidental” churn represents low-hanging fruit that can lift overall revenue by 8.6% in the first year alone. This highlights a hidden risk factor that impacts your company’s revenue stability—the same revenue that funds your commission structure.
During contract negotiations, especially with larger accounts, you can position robust payment methods as partnership stability tools. Encouraging ACH transfers or corporate invoicing over individual credit cards helps de-risk accounts from administrative churn, protecting the deals you worked hard to close.
The Contract Length Effect: Monthly Plans Churn at Double the Rate
Commitment length dramatically impacts retention. Monthly contracts experience 18% churn rates compared to just 8% for two-year agreements. With monthly plans, customers re-evaluate value every 30 days with minimal friction for cancellation.
This data becomes your ammunition for confidently pushing annual contracts. The annual plan isn’t just about securing discounts—it’s about committing to success. Customers with longer commitments invest more in onboarding, dedicate necessary implementation resources, and persist through initial learning curves.
Statistical evidence shows that customers who commit for a year are significantly more likely to achieve their desired business outcomes. In this light, selling annual plans isn’t a pricing strategy—it’s selling a higher probability of customer success.
The Market Shift: New Sales Drop 3.3% While Churn Also Decreases 3.3%
A fascinating 2024 trend emerged: B2B SaaS new sales dropped 3.3% in challenging economic conditions, but churn also decreased by the same percentage. This counterintuitive pattern suggests that while acquiring new customers became more difficult, existing customers demonstrated stronger loyalty to trusted solutions.
This market shift has two direct implications. First, prospect acquisition becomes more challenging. Buyers are more discerning, budgets are tighter, and they’re less likely to switch from reasonably satisfactory incumbent solutions. Your discovery process, value proposition, and competitive differentiation must be flawless.
Second, it dramatically increases the strategic importance of customer success relationships. In markets where new leads are scarce and skeptical, your best source of growth is the satisfied customer base. Happy customers provide referrals, testimonials, and case studies that serve as essential social proof for hesitant new prospects.

