🎉Find Prospects and Send Cold Emails & LinkedIn Outbound | All in One Place

Sales Compensation Statistics: Your Complete Guide to Maximizing Earnings in 2024/2025

Table of Contents

Sales Compensation Statistics 

  • Average quota attainment rates hover below 40% for certain sales roles, making high OTE meaningless if unachievable
  • Pipeline generation roles typically have a 68% fixed base pay to 32% variable compensation split structure
  • Revenue-closing roles shift toward 44% fixed base pay to 56% variable compensation, increasing risk and reward
  • Healthy Quota-to-OTE ratio ranges from 4:1 to 6:1, revealing how much revenue you must generate per dollar earned
  • Unrealistic sales targets rank as the top reason sales professionals want to leave their jobs in the industry
  • Companies with strong compensation programs experience 50% higher employee retention rates than those with weak programs
  • Companies that regularly review compensation plans see 22% higher employee retention than those that don’t adjust pay
  • Pipeline generation median base pay ranges from $55,000 to $60,000, with median OTE at $80,000
  • Pipeline generation top performers can achieve OTE exceeding $130,000, with average quota attainment at 53.4%
  • Mid-market revenue median base pay ranges from $85,000 to $101,250, with median OTE at $160,000
  • Mid-market revenue top performers can surpass $389,000 OTE, but average quota attainment is only 38.8%
  • Enterprise revenue median base pay ranges from $120,000 to $180,000, with median OTE at $250,000
  • Enterprise revenue top performers can exceed $617,000 OTE, but average quota attainment drops to 36.8%
  • New hires typically take 4 to 6 months to meet quota during the ramp-up period after joining
  • Dial-to-Connect Rate benchmark for reaching decision-makers is 3% to 10%, with rates below 3% indicating data quality issues

Understanding sales compensation isn’t just about knowing your worth—it’s about protecting your career from unrealistic targets and positioning yourself for maximum earnings. Whether you’re evaluating a new opportunity or negotiating your current package, compensation data reveals the truth behind attractive offers.

The uncomfortable reality? Most sales professionals accept roles without understanding if the targets are even achievable. With average quota attainment rates hovering below 40% for certain roles, a high on-target earnings number means nothing if the quota is impossible to hit.

This guide arms you with the compensation statistics, performance benchmarks, and negotiation strategies you need to make informed career decisions and avoid the burnout that comes with broken compensation structures.

What Sales Compensation Statistics Actually Reveal

Sales compensation statistics expose how companies structure pay across roles, industries, and experience levels. These numbers track more than simple salary figures—they reveal the balance between financial security and performance-based upside that defines your earning potential.

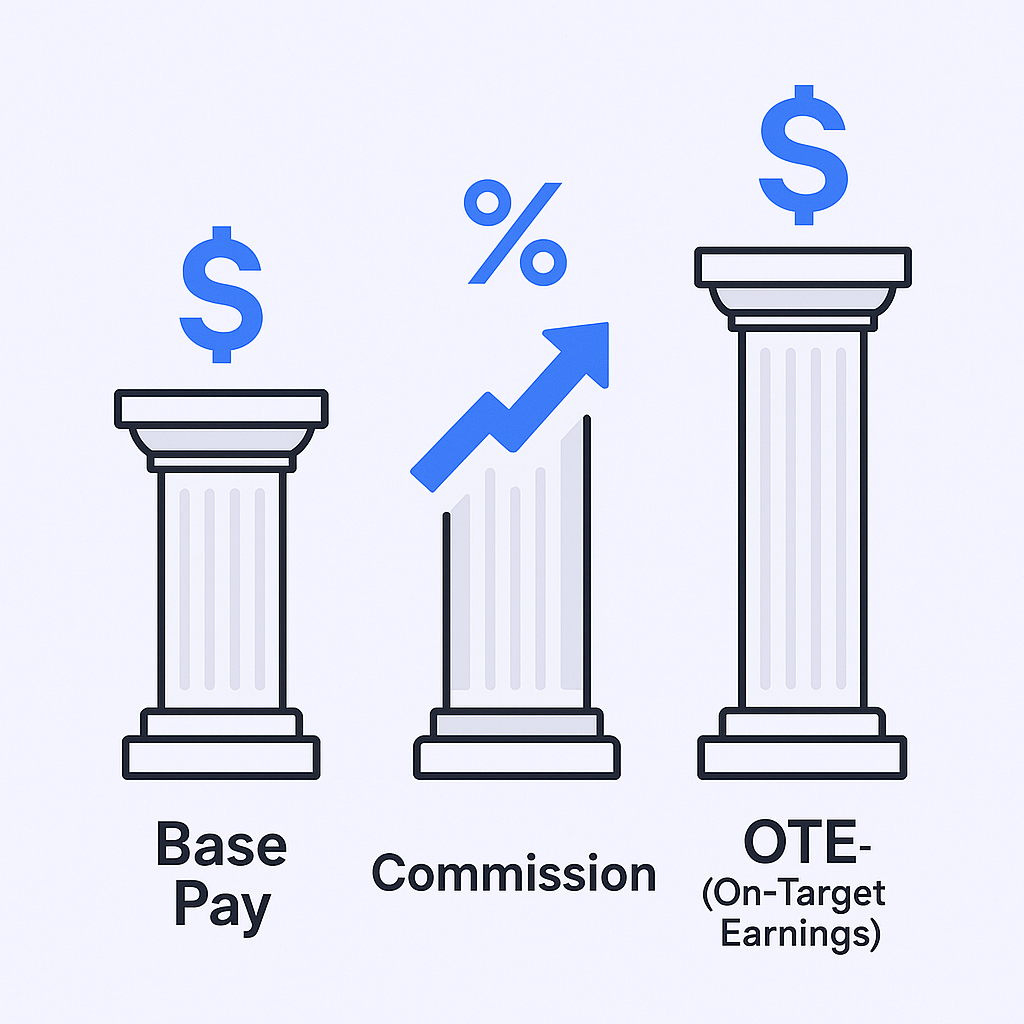
The Three Pillars of Sales Pay

On-Target Earnings (OTE) represents your total expected income when hitting 100% of quota. It’s the blend of guaranteed money and performance-based commissions that forms the foundation of any sales role evaluation.

Base Pay is your guaranteed income regardless of quota achievement. A strong base provides stability for living expenses while compensating for non-selling activities like training, administrative work, and pipeline research. This fixed component protects you during ramp periods and slow quarters.

Commission is your performance-based income, tied to specific milestones like meetings booked or revenue closed. This variable component directly rewards your ability to execute and close deals.


Decoding Pay Mix: Your Risk-Reward Indicator

The ratio between fixed and variable pay—the pay mix—is your single best indicator of financial risk and reward. This split typically correlates with how directly you influence closed revenue.

For pipeline generation roles focused on the top of the funnel, companies provide more security because you have less control over whether qualified leads close months later. The typical split is 68% fixed base pay to 32% variable compensation. This structure recognizes that entry-level positions require stability while still rewarding strong activity.

For revenue-closing roles, the risk increases dramatically, but so does earning potential. The typical split shifts toward variable compensation at 44% fixed base pay to 56% variable. This heavier weighting on variable pay incentivizes deal negotiation, stakeholder management, and aggressive closing, directly aligning your earnings with company financial success.

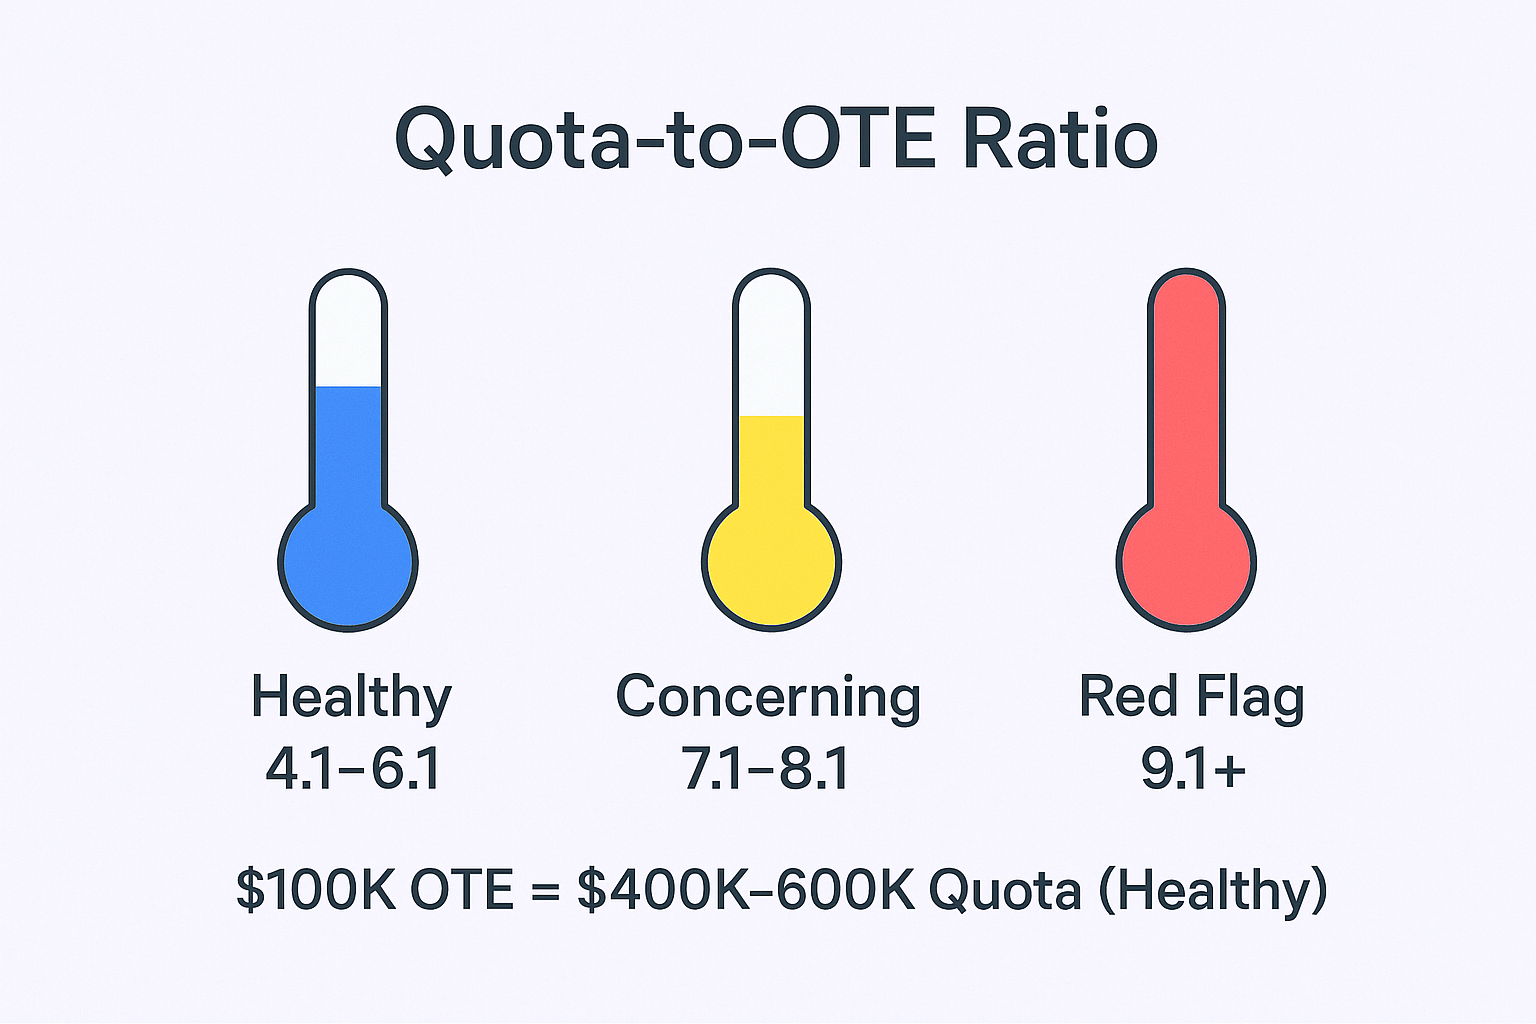
The Quota-to-OTE Ratio: Your Red Flag Detector

A high OTE looks attractive on paper, but the critical question is: how much revenue must you generate to earn it?

The Quota-to-OTE ratio divides your total sales quota by your OTE. This metric reveals the leverage factor—for every dollar the company pays you, how many dollars of revenue must you deliver? The healthy range is 4:1 to 6:1.

If you’re offered $100,000 OTE with a 4:1 ratio, you’re expected to close $400,000 in Annual Contract Value. If that ratio stretches to 8:1 or 10:1, the target is excessively aggressive and likely unrealistic. High performers use this benchmark to vet opportunities and avoid targets designed to fail, protecting themselves from roles that lead to high turnover.


Why These Statistics Matter for Your Career

Understanding compensation statistics isn’t about comparing dollar figures—it’s about assessing risk, measuring market value, and ensuring career sustainability.

The Real Cost of Unrealistic Targets

Industry data reveals a direct correlation between flawed compensation structure and employee turnover. Unrealistic sales targets rank as the top reason sales professionals want to leave their jobs, with uncompetitive pay and benefits coming in second.

When a company advertises competitive OTE but internal data shows only a small percentage consistently hits quota, that high OTE is deceptive. The risk of burnout and poor job satisfaction is extreme in such environments. Analyzing compensation statistics allows you to look past advertised numbers and assess the operational feasibility of the role.

Benchmarking Gives You Negotiation Power

Market benchmarks reveal what the industry considers fair pay for specific roles, adjusted for location and experience. This transparency helps companies design sustainable compensation plans—and gives you objective data to anchor salary negotiations.

By knowing median and top-earner OTE potential for your role, you can argue for higher starting salary, increased commission rates, or better accelerators based on your track record. For instance, knowing top performers can exceed $130,000 OTE gives high performers strong leverage when discussing career progression.

The Retention Connection

Companies with strong sales compensation programs experience 50% higher employee retention rates than those with weak programs. The structure and transparency of your pay plan—not just the size of your check—are powerful retention levers.

Furthermore, companies that regularly review and adjust compensation plans to market standards see 22% higher employee retention. Failure to update compensation data signals lack of investment in the sales force, often pushing top performers to seek opportunities where pay structures are proactively managed and kept competitive.

Current Compensation Benchmarks: Know Your Market Value

The difference in earning potential between entry-level pipeline roles and enterprise revenue roles is substantial. Use these benchmarks to pinpoint your current market value and project future earnings.

Pipeline Generation Roles: The Entry Point

These roles focus on generating qualified pipeline for closing teams. While OTE is lower than revenue-closing positions, base pay provides necessary financial predictability:

  • Median Base Pay: $55,000 to $60,000
  • Median OTE: $80,000
  • Top Performer Potential: OTE exceeding $130,000
  • Average Quota Attainment: 53.4%

Mid-Market Revenue Roles: The Financial Leap

Mid-market professionals typically manage moderate to high ACV deals with shorter sales cycles than enterprise. This represents the first major financial jump in a sales career:

  • Median Base Pay: $85,000 to $101,250
  • Median OTE: $160,000
  • Top Performer Potential: OTE surpassing $389,000
  • Average Quota Attainment: 38.8%

Enterprise Revenue Roles: Maximum Earning Potential

Enterprise positions manage the largest, most complex deals, justifying the highest compensation and greatest financial rewards:

  • Median Base Pay: $120,000 to $180,000
  • Median OTE: $250,000
  • Top Performer Potential: OTE exceeding $617,000
  • Average Quota Attainment: 36.8%

The Quota Attainment Reality

Despite high OTE potential, average attainment rates reveal a serious industry risk factor. While pipeline roles average 53.4% attainment, revenue roles drop significantly: mid-market averages 38.8% attainment, and enterprise averages only 36.8%.

This pattern shows that median OTE figures are rarely achieved by the majority. When less than 40% of the team hits quota, it indicates systemic issues—unrealistic quota setting, insufficient market fit, or bottlenecks in the qualification process. Anyone considering a transition must scrutinize a company’s sales process and training, as performance will be inherently limited by these systemic factors.

💰 Stop Missing Quota Due to Pipeline Issues

Our LinkedIn outbound system delivers consistent, qualified meetings so your team can focus on what they do best—closing

Performance Metrics That Drive Your Compensation

For performance to drive your variable compensation, the metrics used must accurately reflect value creation, not mindless activity. Modern compensation plans prioritize quality outcomes tailored to each role.

Pipeline Generation Metrics: Quality Over Volume

Compensation must balance activity—sheer volume of outreach—with conversion quality. Pay based purely on quantity (dials, emails sent) leads to low-quality outcomes that waste resources. Hybrid models are essential.

Key activity metrics that correlate with high performance include:

Dial-to-Connect Rate: The benchmark for reaching decision-makers is 3% to 10%. Rates below 3% suggest data quality issues that undermine effectiveness.

Average Talk Time: Quality discovery calls should last 2.5 to 10 minutes. Short talk times indicate rushed conversations or failure to effectively uncover pain points.

The primary driver of pipeline role variable pay is the outcome: Qualified Meetings Held or Opportunities Created. Compensating on quality outcomes ensures you prioritize leads that truly fit the Ideal Customer Profile, fueling a robust pipeline for revenue teams.

🎯 Get Qualified Meetings That Actually Convert

We build targeting strategies and automated campaigns that fill your calendar with ICP-matched prospects ready to buy

Revenue Role Metrics: Results and Profitability

Revenue role performance is judged by closed revenue, typically tied to Annual Contract Value (ACV). Beyond hitting overall quota (achieved by less than 40% of enterprise professionals), compensation increasingly reflects deal health:

Gross Margin Commission: Advanced compensation plans calculate commission based on gross profit, not just total revenue. This incentivizes minimizing discounts and holding pricing, ensuring every sale meaningfully contributes to company profitability.

Conversion Rates: Improving conversion rates at every pipeline stage (from discovery to closed-won) is critical to boosting quota attainment. Low conversion rates may indicate poor upstream qualification or skill gaps in objection handling.

The Ramp-Up Period: Setting Yourself Up for Success

For new hires, the ramp period is crucial for setting expectations and ensuring stability. It typically takes four to six months to meet quota.

To support this period, companies use specific ramp compensation models:

Non-Recoverable Draw: New hires receive advance payment against future commissions, providing guaranteed income during training and first sales cycles.

Promotional Ramps: When moving from pipeline to revenue roles, a full ramp may not be necessary if you already have deep product and process knowledge. In these cases, a lower quota with higher commission rates in the first quarter ensures motivation without excessive pressure.

How to Apply These Statistics to Accelerate Your Career

The ultimate value of compensation statistics is making better career decisions. This data transforms opaque salary negotiations into fact-based processes, ensuring long-term financial success.

Evaluating Compensation Plan Health

A high OTE must always be balanced against internal quota attainment rates. Since unrealistic targets are the primary reason professionals leave, roles with average attainment below 40% signal extreme risk.

When vetting a new opportunity, seek historical data on team attainment. If data suggests a large percentage misses targets, the sales motion or compensation plans are fundamentally broken, regardless of how attractive the package appears. Healthy organizations set achievable targets that stretch the team but remain within reach.

📈 Build Predictable Pipeline for Your Team

Our complete LinkedIn outbound strategy ensures your sales team has the pipeline volume they need to hit quota consistently

Negotiation Strategy for High Performers

Use specific compensation data to anchor negotiations, targeting top-earner potential figures.

Anchoring Fixed Income: If median base pay is $101,250, proven performers should anchor negotiations above that figure.

Negotiating Accelerators: Focus discussions on accelerators—increased commission rates applied once quota is surpassed. Accelerators are the mechanism by which top enterprise professionals earn OTEs exceeding $617,000. These are critical for maximizing upside earnings.

Career Transitions: When moving from pipeline to revenue roles, negotiate based on past performance (conversion rates and opportunity volume). Request a faster ramp schedule or immediate full quota if you already possess core skills like negotiation, multi-threading, and pipeline ownership. A proper ramping compensation plan can make or break success in the first 90 days.

Beyond Commission: Career Pathing for Retention

While money motivates, long-term retention depends on growth opportunities. Organizations boost engagement by linking compensation structures to career progression.

A crucial retention strategy involves providing “earn-up” opportunities—mechanisms where professionals can earn additional commission by taking on advanced responsibilities, such as shadowing complex negotiations or contributing to proposal development. This approach rewards financially while bridging skill gaps necessary for advancement, including pipeline ownership and contract negotiation. By providing clear, compensated pathways to advancement, companies ensure high-potential talent remains engaged and committed to long-term performance.

Leveraging Technology to Maximize Your Compensation

In today’s competitive landscape, sales professionals who leverage the right technology outperform those who don’t. The difference between hitting quota and missing it often comes down to efficiency in your outreach and follow-up.

🚀 Scale Outreach Without Scaling Headcount

We design and manage LinkedIn campaigns that generate meetings at scale while maintaining personalization and deliverability

7-day Free Trial |No Credit Card Needed.

Salesso is built specifically to help sales professionals maximize their compensation by automating the most time-consuming parts of outreach. With features like unlimited email sending, advanced personalization, and automated follow-up sequences, Salesso ensures you spend more time closing deals and less time on manual tasks.

The platform’s deliverability optimization means your carefully crafted messages actually reach decision-makers—a critical factor when your commission depends on qualified meetings and closed deals. With built-in A/B testing and detailed analytics, you can continuously optimize your approach to improve conversion rates, directly impacting your variable compensation.

For sales professionals serious about maximizing their earnings, Salesso eliminates the busywork that prevents you from hitting your numbers. When your compensation depends on performance, every qualified meeting matters—and Salesso helps you generate more of them.

FAQs

What is a good OTE for a sales position?

A good OTE depends on your role and experience level. For pipeline generation roles, $80,000 is the median, with top performers exceeding $130,000. For mid-market revenue roles, median OTE is $160,000, while enterprise roles command median OTE of $250,000. Always evaluate OTE against the Quota-to-OTE ratio (healthy range: 4:1 to 6:1) to ensure the target is achievable.

What is the typical base salary to commission split in sales?

The split varies by role proximity to closed revenue. Pipeline generation roles typically see 68% base to 32% commission, providing more stability. Revenue-closing roles shift to 44% base and 56% commission, reflecting higher risk and reward. This pay mix is your best indicator of financial risk in any sales position.

What are sales accelerators and why do they matter?

Accelerators are increased commission rates applied once you surpass 100% quota attainment. They're the mechanism by which top performers dramatically increase their earnings—for example, how enterprise professionals earn OTEs exceeding $617,000. Always negotiate accelerators as part of your compensation package, as they maximize your upside potential.

Why do most sales professionals miss quota?

Average quota attainment rates are 53.4% for pipeline roles, 38.8% for mid-market revenue roles, and 36.8% for enterprise roles. Low attainment typically indicates systemic issues: unrealistic quota setting, insufficient market fit, poor lead quality, or bottlenecks in the sales process. Before accepting a role, research the company's historical attainment rates to assess if targets are achievable.

How should I negotiate my sales compensation package?

Use market benchmarks to anchor your negotiation above median figures if you're a proven performer. Focus on three areas: base salary (should be at or above median for your role), commission rates (negotiate higher percentages), and accelerators (critical for maximizing upside). Request historical team attainment data to validate that the OTE is genuinely achievable based on the Quota-to-OTE ratio.

Conclusion

Sales compensation is the largest lever companies use to shape seller behavior, and understanding the data behind it is non-negotiable for maximizing earnings and minimizing career risk.

For pipeline generation professionals, focus on maximizing stable base pay and ensuring variable pay is tied to high-quality outcomes like qualified opportunities. This prepares you for the revenue-focused metrics that come with career advancement.

For revenue professionals, critically evaluate advertised OTEs against the sobering reality of industry quota attainment rates. Use the 4:1 to 6:1 Quota-to-OTE ratio and internal attainment statistics as key vetting tools before accepting any offer.

Transparency in compensation data, coupled with competitive and achievable compensation plans, leads directly to more engaged and higher-performing sales careers. The statistics in this guide give you the foundation to negotiate better packages, avoid broken compensation structures, and build a sustainable, lucrative sales career.

Your next move: take these benchmarks, evaluate your current compensation against market rates, and use the data to either negotiate a better package or find an opportunity that values your performance appropriately. The market rewards those who know their worth—and can prove it with data.

Maximize Your Sales Team's Performance

Our LinkedIn outbound engine fills your pipeline with qualified leads while you focus on closing deals

Segmentation That Actually Converts

LinkedIn outbound targets precise demographics with strategic campaign design and scaling methods