

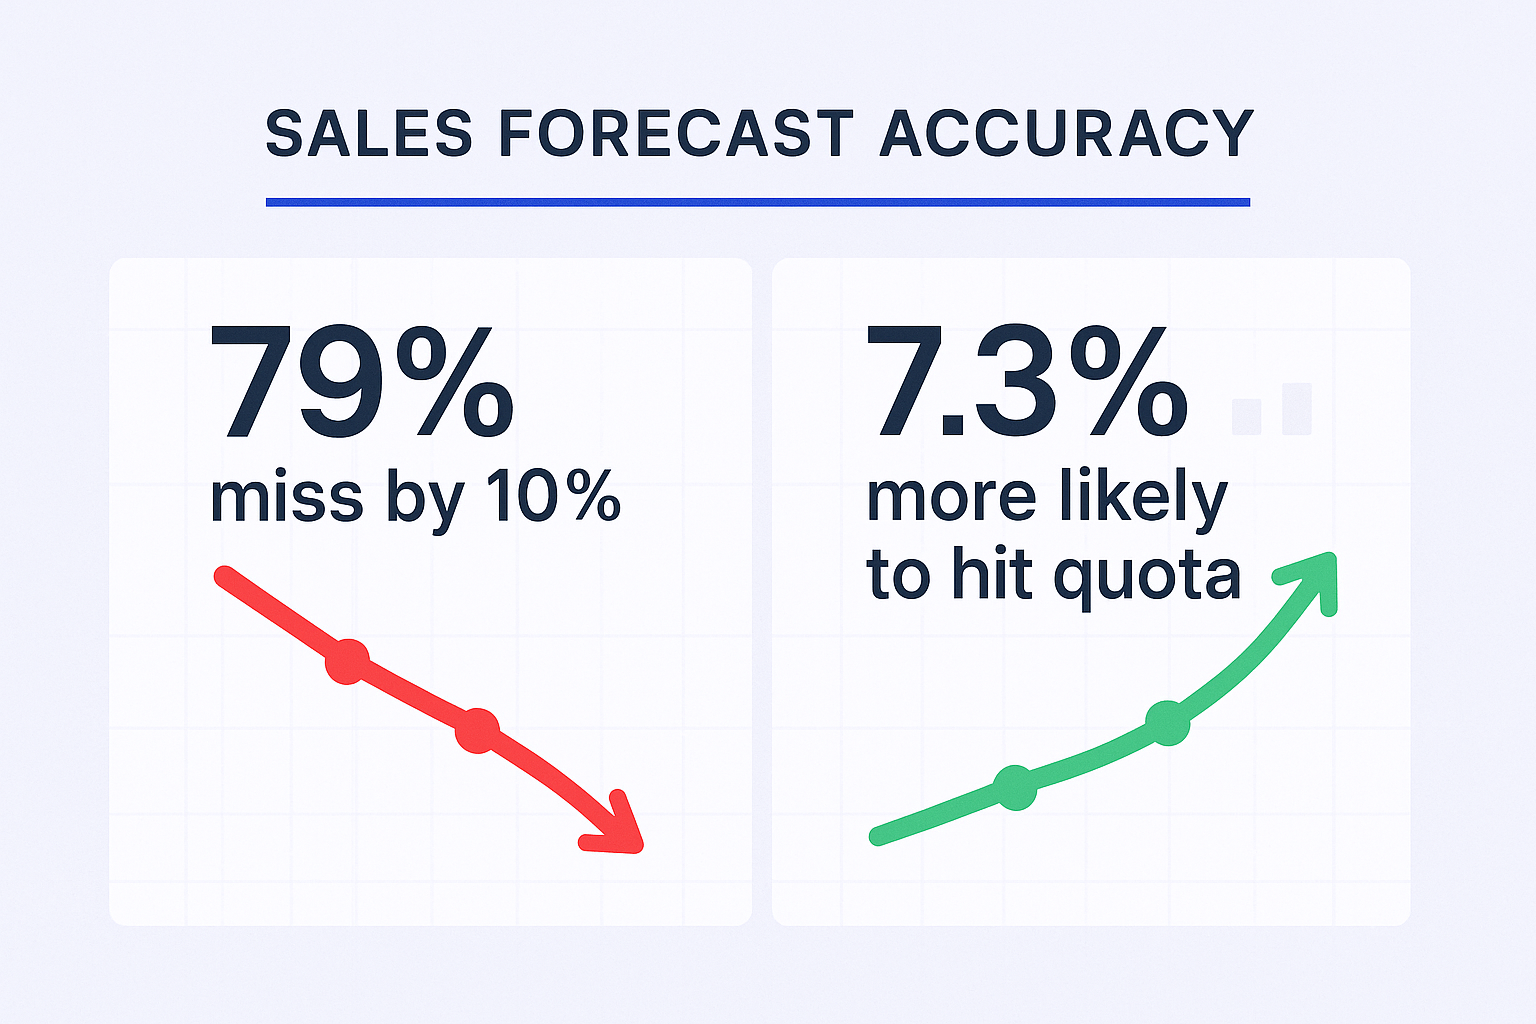
Here’s the uncomfortable truth: 79% of sales organizations miss their forecast by more than 10%.
That’s not just embarrassing—it’s expensive. When your prediction is off, Finance over-hires for growth that never shows up, Operations can’t deliver on time, and everyone scrambles to explain the gap to leadership.
But here’s the good news: the companies that nail their forecasting? They’re 7.3% more likely to hit quota. And the gap between average and elite isn’t some secret sauce—it’s just discipline, better data, and knowing which numbers actually matter.
Let’s cut through the noise and get you to accurate predictions faster.
What is sales forecasting?
A sales forecast is your best educated guess about future revenue based on real data—not wishful thinking.
It combines three inputs: what you’ve closed historically, what’s sitting in your pipeline right now, and what the market is actually doing. Think of it as your GPS for revenue. Without it, you’re just driving blind and hoping you end up somewhere good.
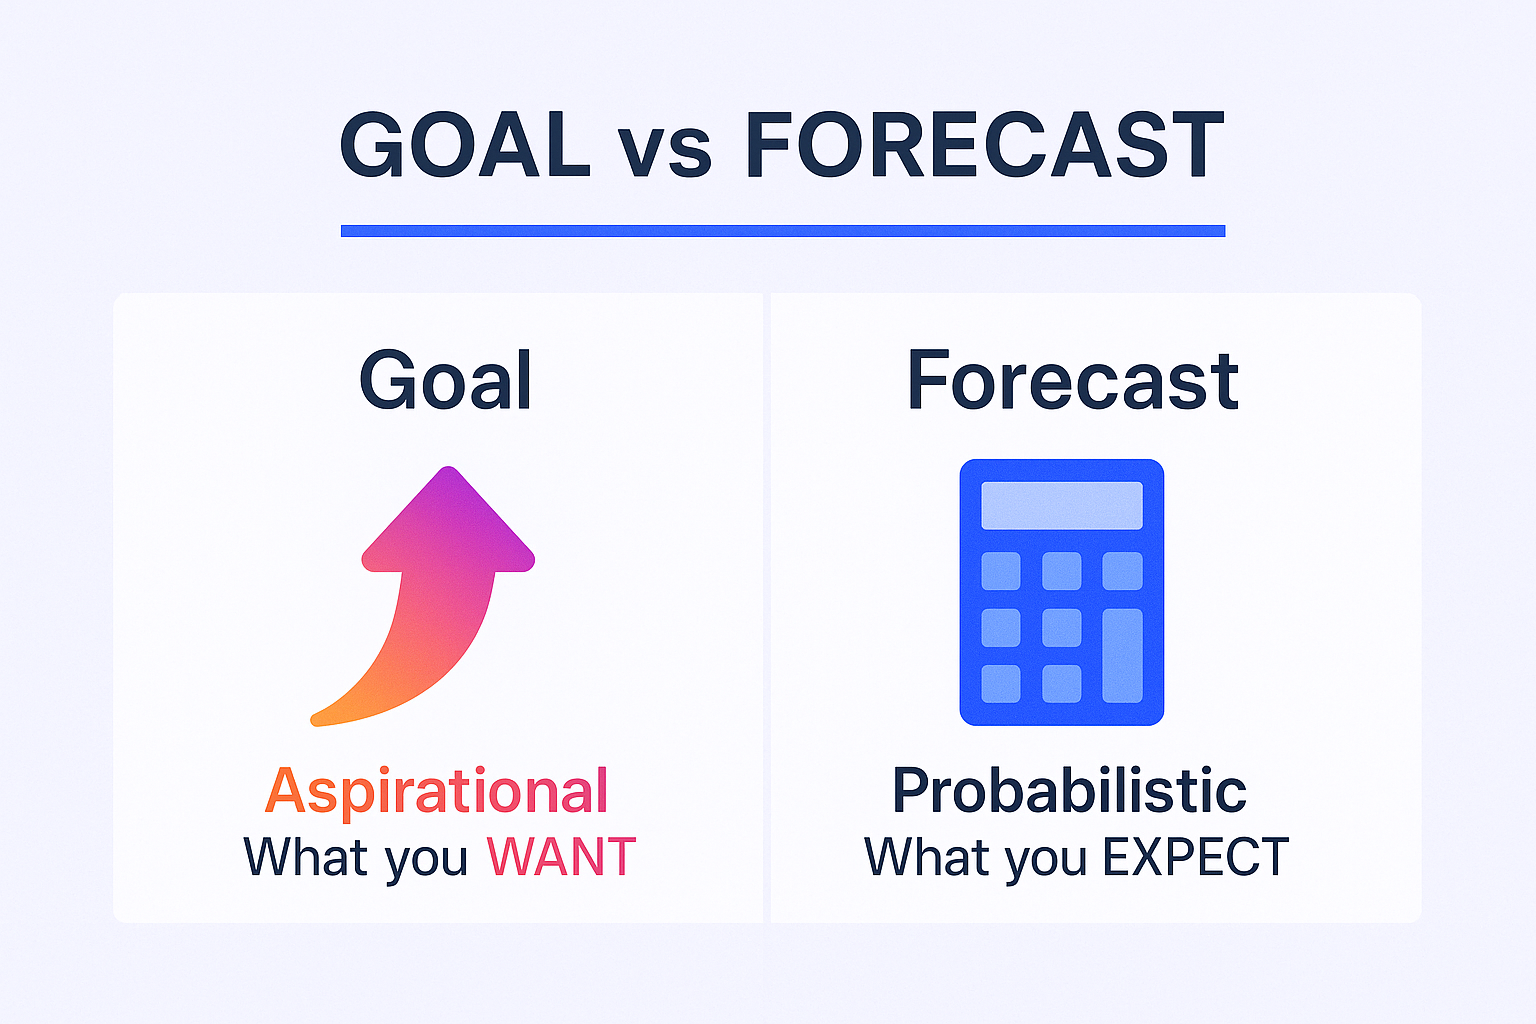
Here’s the critical distinction most people miss: A forecast isn’t a goal. Your goal is aspirational—what you want to close. Your forecast is probabilistic—what you actually expect to close based on evidence.
Finance makes hiring decisions based on your forecast. Operations orders inventory. Marketing plans campaigns. When your prediction is wrong, everyone downstream pays for it with chaos and missed opportunities.
Why is sales forecasting important?
Because 50% of executives report delayed deliverables when forecasts miss the mark, and 46% lose real business opportunities they could have captured.
Let me paint the picture: You overestimate revenue. Finance hires 20 new people. Three months later, that revenue doesn’t materialize. Now you’re burning cash on salaries while scrambling to course-correct. Or flip it—you underestimate. You don’t staff Customer Success properly, implementation backlogs pile up, and customers churn because you can’t deliver fast enough.
The organizations that consistently deliver accurate forecasts target a minimum of 85% accuracy, with best-in-class teams regularly achieving 90-95% accuracy.
Then comes the critical handoff. Once an opportunity enters the pipeline, ownership shifts to managing the full cycle. This requires intimate knowledge of the customer’s world: their budget constraints, internal politics, competing priorities, and real timeline.
The “commit” call—that firm promise about which deals are locked for the period—only works if it’s grounded in verified facts, not optimistic guesses.
Here’s the table that shows how daily actions translate directly into forecast reliability:
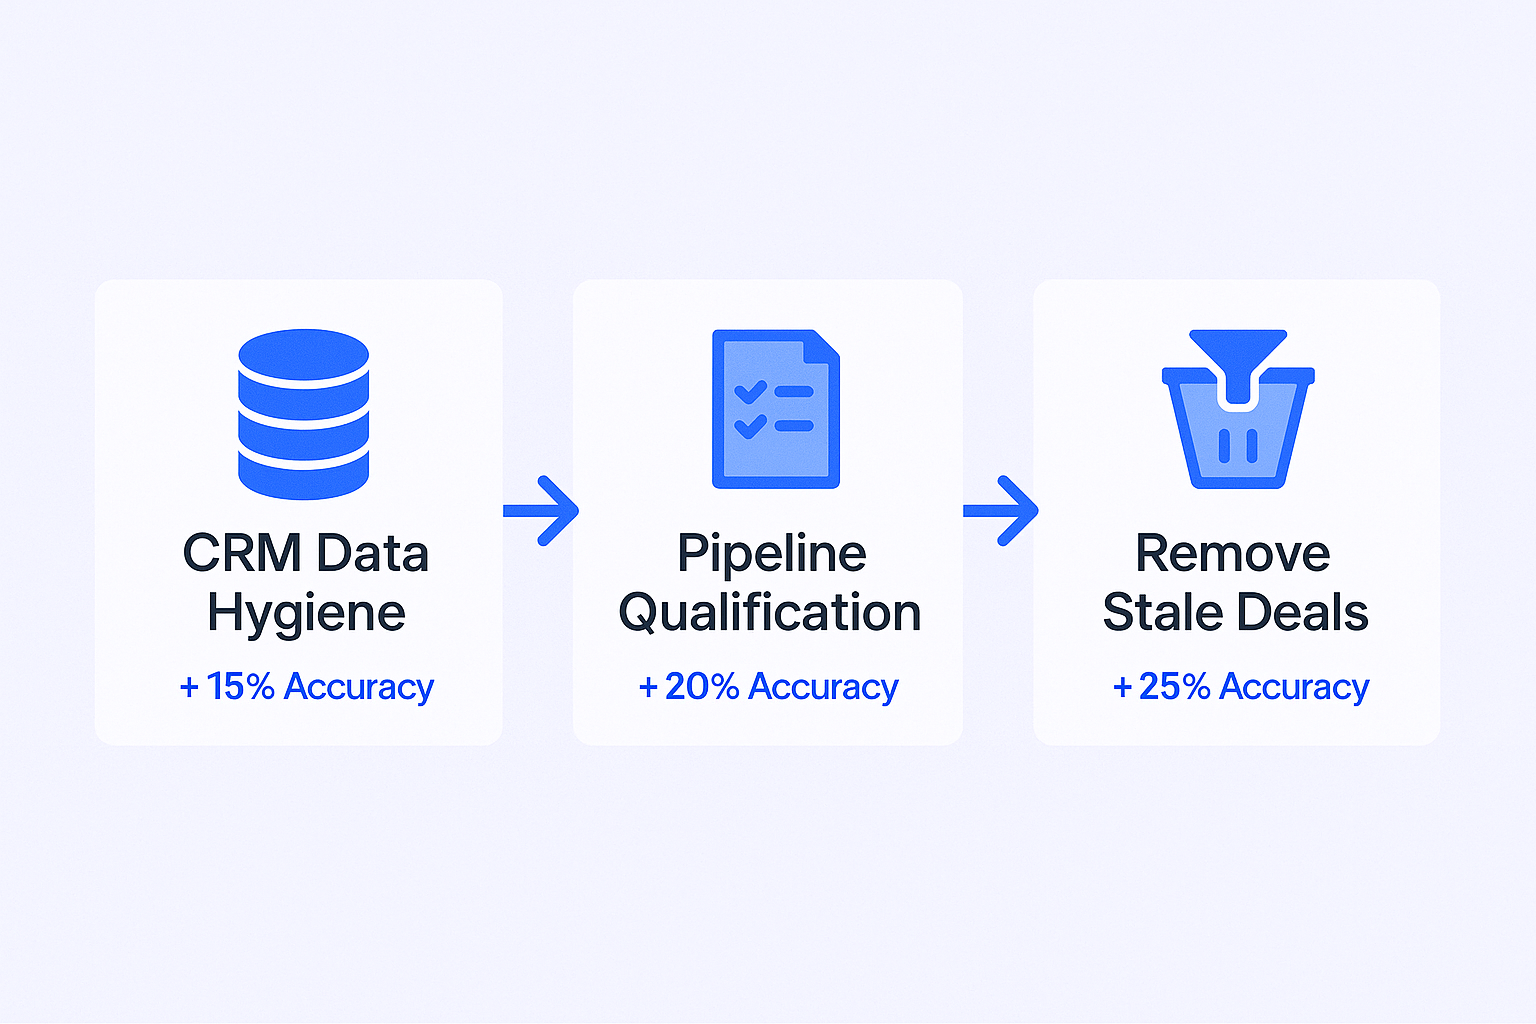
Key Daily Action | Direct Impact on Forecast Accuracy |
Maintaining CRM Data Hygiene (Accurate contact roles, updated fields) | Ensures weighted probabilities are based on verifiable data, preventing data decay losses |
Pipeline Qualification (Using MEDDPICC/BANT framework) | Reduces subjective bias by confirming Budget, Economic Buyer, and Decision Process |
Removing Stale Deals (No activity >30 days) | Prevents pipeline clutter and inflated forecasts. Stale deals are 80% less likely to close |
Sales forecasting methods and when to use them
The best approach isn’t picking one method—it’s blending quantitative data with experienced human judgment.
Weighted Pipeline Forecasting
This is your data foundation. Every stage in your sales process gets a probability percentage based on historical close rates. “Discovery” might be 25%. “Proposal Sent” might be 60%. “Negotiation” could be 90%.
You take each deal’s value, multiply it by its stage probability, and suddenly you have a weighted revenue estimate that’s far more realistic than raw pipeline totals.
When to use it: Complex B2B sales with long cycles and multiple stakeholders. When you need structure to remove guesswork.
The catch: The whole system collapses if your data is dirty or if reps game the system by pushing deals forward prematurely. Garbage in, garbage out.
Intuitive Forecasting
This is where experienced judgment enters. You know things the data doesn’t capture: the executive sponsor seems distracted lately, a competitor just dropped their price, or the champion left the company.
When to use it: When launching new products in unfamiliar markets. When economic conditions shift suddenly. When hard data is limited but you have relevant context.
The trap: Relying purely on intuition is the fastest route to the “optimism trap”—that tendency to overestimate your chances because you want the deal to close.
The Synthesis Approach
Here’s what actually works: Use weighted pipeline as your baseline reality check. Then layer in intuitive adjustments for factors the data can’t capture. Your final forecast should be the most conservative number among your system calculation, your manager’s expectation, and your gut feel.
This triangulation keeps you honest and grounded in both data and reality.
How to forecast sales step by step
Creating a reliable forecast isn’t complicated, but it requires discipline. Here’s the three-step process that actually works:
Step 1: Pipeline Hygiene—Eliminate the Ghosts
Before you calculate anything, audit your pipeline for “zombie deals”—those opportunities with no activity for 30+ days.
Research shows these stale opportunities are 80% less likely to close. Including them automatically inflates your forecast and guarantees you’ll miss your number.
The fix is simple but requires courage: remove them, archive them, or re-qualify them from scratch. But don’t include them in your commit.
Step 2: Deep Qualification—Pressure-Test Every Deal
Optimism kills forecast accuracy. To stay grounded, use a standardized qualification framework like MEDDPICC (Metrics, Economic Buyer, Decision Criteria, Decision Process, Identify Pain, Champion, Competition) on every deal you’re committing.
This isn’t bureaucracy—it’s risk management. If you can’t confirm the Economic Buyer or you don’t understand their Decision Process, your probability needs to drop, regardless of how confident you feel.
Frameworks convert unknown risks into measurable variables, which stabilizes your predictions.
Step 3: Calculate and Triangulate Your Weighted Revenue
Once your pipeline is clean and deals are qualified, calculate your weighted baseline: Deal Value × Stage Probability for each opportunity.
Then triangulate against three inputs:
- The system-generated forecast
- Your manager’s expectation
- Your personal intuitive assessment
Your final commit should always be the most realistic, conservative number among these three. Here’s what that calculation looks like in practice:
Deal Stage | Standard Probability (%) | Deal Value | Weighted Forecast Value |
Discovery/Qualified | 25% | $50,000 | $12,500 |
Proposal Delivered | 60% | $75,000 | $45,000 |
Negotiation/Commit | 90% | $100,000 | $90,000 |
Total Forecast | N/A | $225,000 | $147,500 |
Notice the gap between raw pipeline ($225k) and weighted reality ($147.5k). That $77,500 difference is where most missed forecasts live.
Common challenges in sales forecasting (and how to solve them)
Two problems kill forecast accuracy more than anything else: human bias and dirty data.
Challenge A: The Optimism Trap
Sales professionals are wired to be optimistic—it’s how you survive rejection. But that same trait destroys forecast accuracy when you convince yourself a deal is “90% likely to close” while historical data shows similar deals at that stage only close 40% of the time.
The solution: Stop relying on gut feel alone. Balance every intuitive assessment against objective historical metrics. And demand that Revenue Operations enforces standardized stage definitions. If “Proposal Sent” means different things to different reps, your weighting system is useless.
Challenge B: Data Decay
Poor data quality is recognized as the single most critical factor determining forecast accuracy. Incomplete or outdated CRM records don’t just make reporting annoying—they fundamentally break the prediction engine.
Here’s the friction paradox: Sales reps spend 23% of their time on data entry and administrative tasks. They’re paid to sell, not administer databases, so they resist manual updates. This creates incomplete records, which feeds flawed data to the forecasting system, which produces unreliable predictions.
The solution: Mandate that critical fields (amount, close date, stage, next step) must be complete before deals advance. But more importantly, deploy automation tools that capture activity—emails, calls, meetings—automatically. This removes the administrative burden while simultaneously improving data quality.
Tools and software for sales forecasting
Manual spreadsheet forecasting is dead. Modern technology isn’t just helpful—it’s a competitive requirement.
Companies using automated sales forecasting tools improve their accuracy by 20% or more compared to manual methods. AI can analyze massive datasets and spot patterns that humans inevitably miss.

