🎉Find Prospects and Send Cold Emails & LinkedIn Outbound | All in One Place

Sales Performance Statistics: 13 Key Metrics for 2025

Table of Contents

Sales Performance Statistics

  • Sales reps spend only 28% of their week actually selling, with barely two hours a day on revenue-generating activities
  • 73% of sales professionals missed their H2 quotas in 2023, with 69% still falling short in 2024
  • 80% of B2B sales interactions now happen in digital channels, fundamentally changing sales approaches
  • 72% of companies report that customer journeys have become more complex over the past year
  • B2B e-commerce expanded by 17% in 2023, showing growth is possible despite economic headwinds
  • 70% of sales teams experienced budgets being more heavily scrutinized compared to the previous year
  • Early-stage sales roles hit 56.7% median quota attainment, while enterprise sales drop to 39.4% attainment
  • 79% of marketing leads never convert into sales due to lack of nurturing or poor qualification
  • High-intent leads convert at 75-80%, but only represent 27% of inbound cases in sales pipelines
  • 54% of sales professionals saw Customer Acquisition Cost (CAC) increase over the past year
  • 43% of B2B sales leaders report their sales cycle is getting longer, directly increasing costs
  • 93% of respondents indicated that average deal sizes were holding steady or growing despite market volatility
  • B2B win rates declined 18% year-over-year in 2023 and are down 27% compared to 2021
  • Average B2B sales win rate in 2023 was only 21%, with SaaS slightly better at 22%
  • 47% of B2B companies now involve 3 to 5 decision-makers on buying teams, increasing deal complexity dramatically

Here’s a stat that’ll make you stop scrolling: sales reps spend only 28% of their week actually selling. That’s barely two hours a day doing what they’re hired to do.

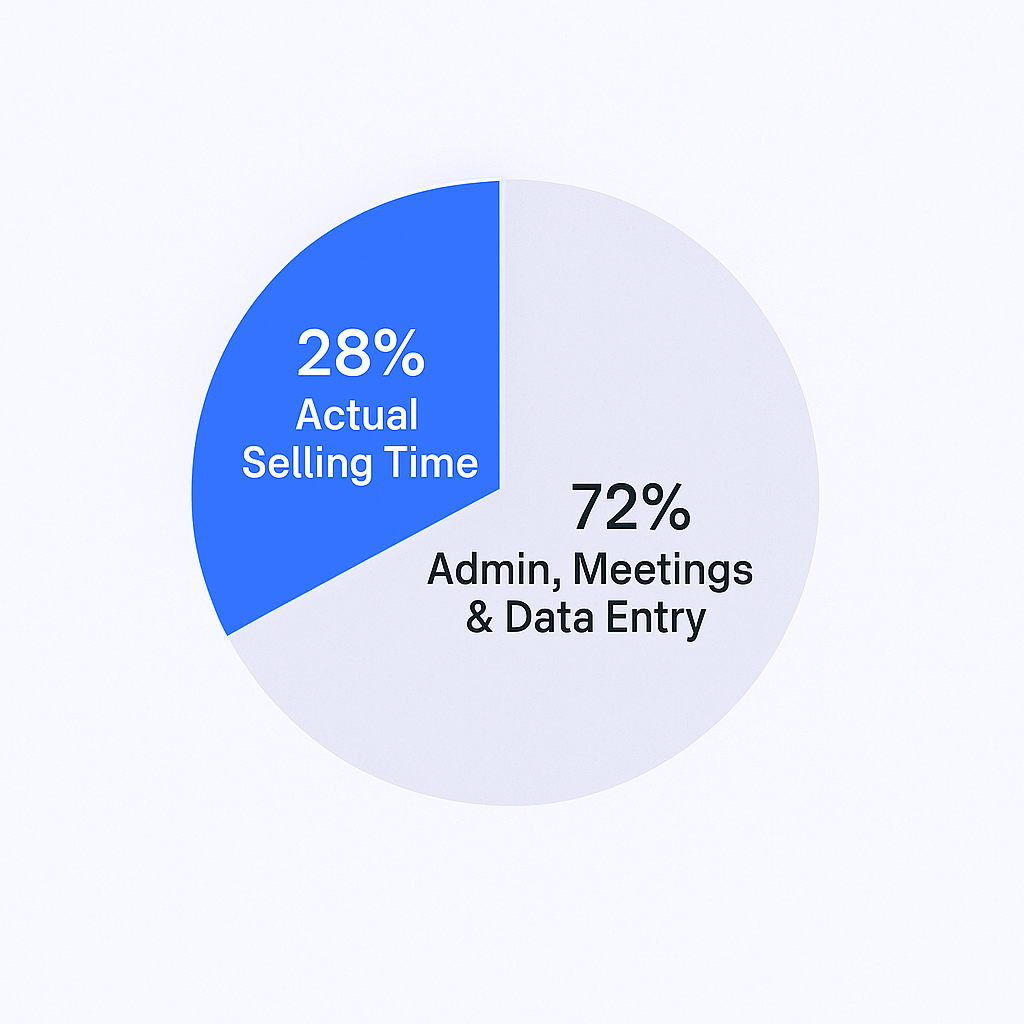
The rest? Admin work. Internal meetings. Data entry. Stuff that doesn’t close deals.

And it gets worse. 73% of reps missed their H2 quotas in 2023, and in 2024, 69% were still falling short. Deals are taking longer to close, buying committees have more people, and budgets are under heavier scrutiny than ever.

But here’s the thing: the teams crushing quota aren’t working harder. They’re working smarter. They’re tracking the right metrics and making data-driven decisions instead of guessing.

This article breaks down the 13 sales performance statistics you need to monitor in 2025. Whether you’re managing a team or carrying your own quota, these metrics will help you identify what’s broken and fix it fast.

Let’s dive in.

What Are Sales Performance Metrics?

Sales performance metrics are the measurable data points that tell you whether your sales efforts are actually working. They connect your daily activities—calls, emails, meetings—to the outcomes that matter: revenue, quota attainment, and growth.

Think of them as your sales GPS. Without metrics, you’re driving blind. You might feel busy, but you have no idea if you’re heading in the right direction.

In 2025, tracking these metrics isn’t optional anymore. 80% of B2B sales interactions now happen in digital channels, and 72% of companies report that customer journeys have become more complex over the past year. You can’t wing it when buyers have more options, more information, and higher expectations than ever before.

The good news? When you track the right numbers, patterns emerge. You see what’s working, what’s not, and where to focus your energy. Let’s break down the 13 metrics that separate winning teams from everyone else.

Top 13 Sales Performance Metrics You Should Track in 2025

Sales Growth

Sales growth measures how much your revenue increases over a specific period. It’s usually expressed as a percentage and calculated by comparing current revenue to a previous timeframe.

Why it matters: B2B e-commerce expanded by 17% in 2023, showing that despite economic headwinds, growth is still possible when you execute well. But here’s the catch—70% of sales teams experienced budgets being more heavily scrutinized compared to the previous year.

This means every dollar you spend needs to show clear ROI. Sales growth isn’t just about celebrating wins anymore; it’s about proving to leadership that your team deserves continued investment. Track it monthly and quarterly to spot trends early.

Sales Target Attainment

This is your “true north” metric. Sales target attainment measures what percentage of quota each rep (or team) actually hits.

The numbers tell a tough story:

  • Early-stage sales roles hit 56.7% median quota attainment
  • Mid-market sales see 42.3% attainment
  • Enterprise sales drop to 39.4% attainment

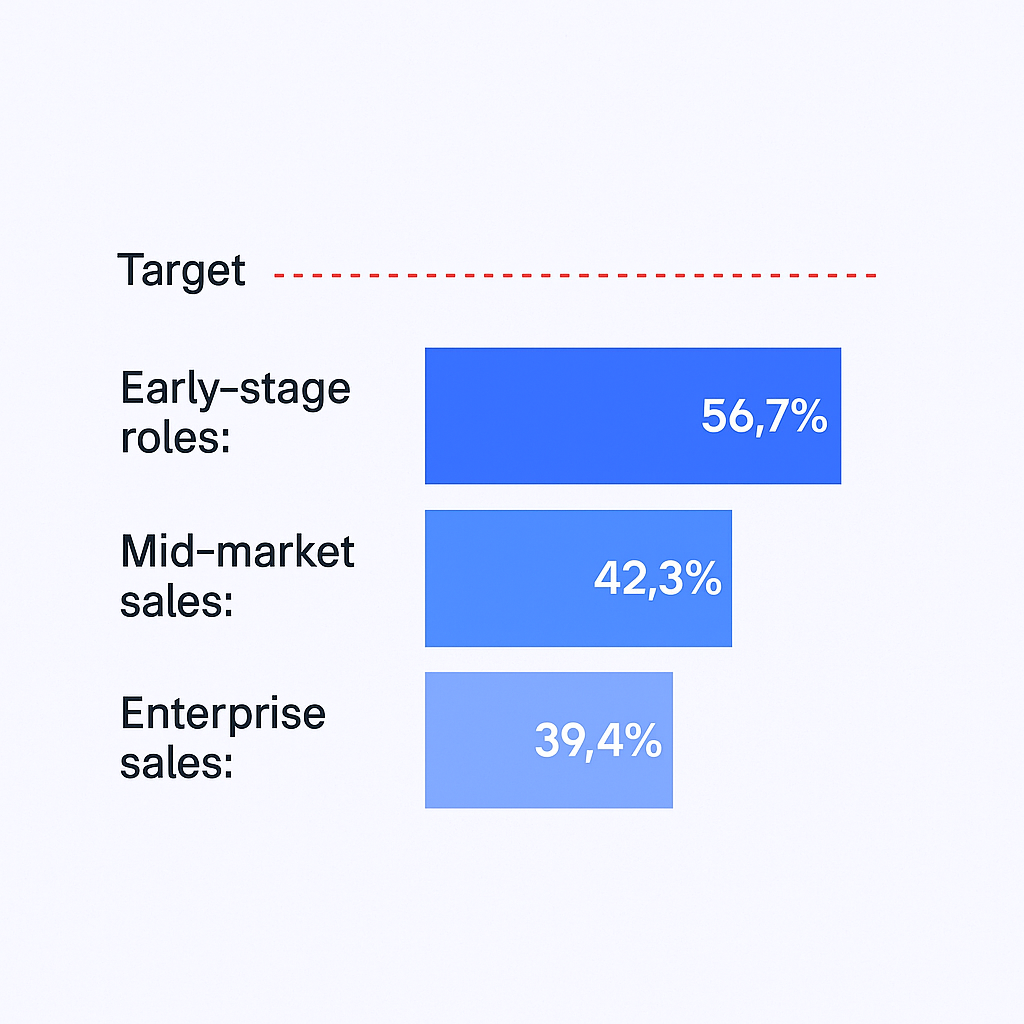
Notice the pattern? As deal complexity increases, attainment drops dramatically. 73% of sales professionals missed their H2 quotas in 2023, and the trend continued into 2024.

This metric directly impacts compensation, career progression, and team morale. If your attainment is trending down, you need to diagnose fast: Is it a skill issue? Market conditions? Poor lead quality? Bad territory assignments?

Sales by Region

Sales by region breaks down performance across different territories, geographies, or market segments. This helps you identify where you’re winning and where you’re leaving money on the table.

Territory planning gives your team clear guidelines on which market segments to pursue. Without it, reps waste time chasing the wrong accounts or stepping on each other’s toes.

Smart teams centralize all territory data—industry, company size, location—in their CRM. This prevents confusion and ensures everyone knows exactly which accounts they own. When territories are well-defined, reps focus their energy instead of spreading themselves thin.

Sales by Product

This metric shows which products or services drive the most revenue. It’s critical for understanding product-market fit and prioritizing where to focus sales efforts.

Good news from the field: 93% of respondents said average deal sizes were holding steady or even growing despite market volatility. This suggests that while deals are harder to close, customers are still willing to pay for real value.

Analyzing sales by product helps you double down on what’s working and fix (or sunset) what’s not. It also informs how you structure compensation plans and allocate resources across your product lines.

Lead Conversion Rate

Lead conversion rate measures how many leads turn into actual opportunities or closed deals. This is where the rubber meets the road.

Here’s the brutal truth: 79% of marketing leads never convert into sales. Most die from lack of nurturing or poor qualification.

The quality gap is massive:

  • Low-intent leads convert at 5-10%
  • High-intent leads convert at 75-80%
  • But high-intent leads only represent 27% of inbound cases


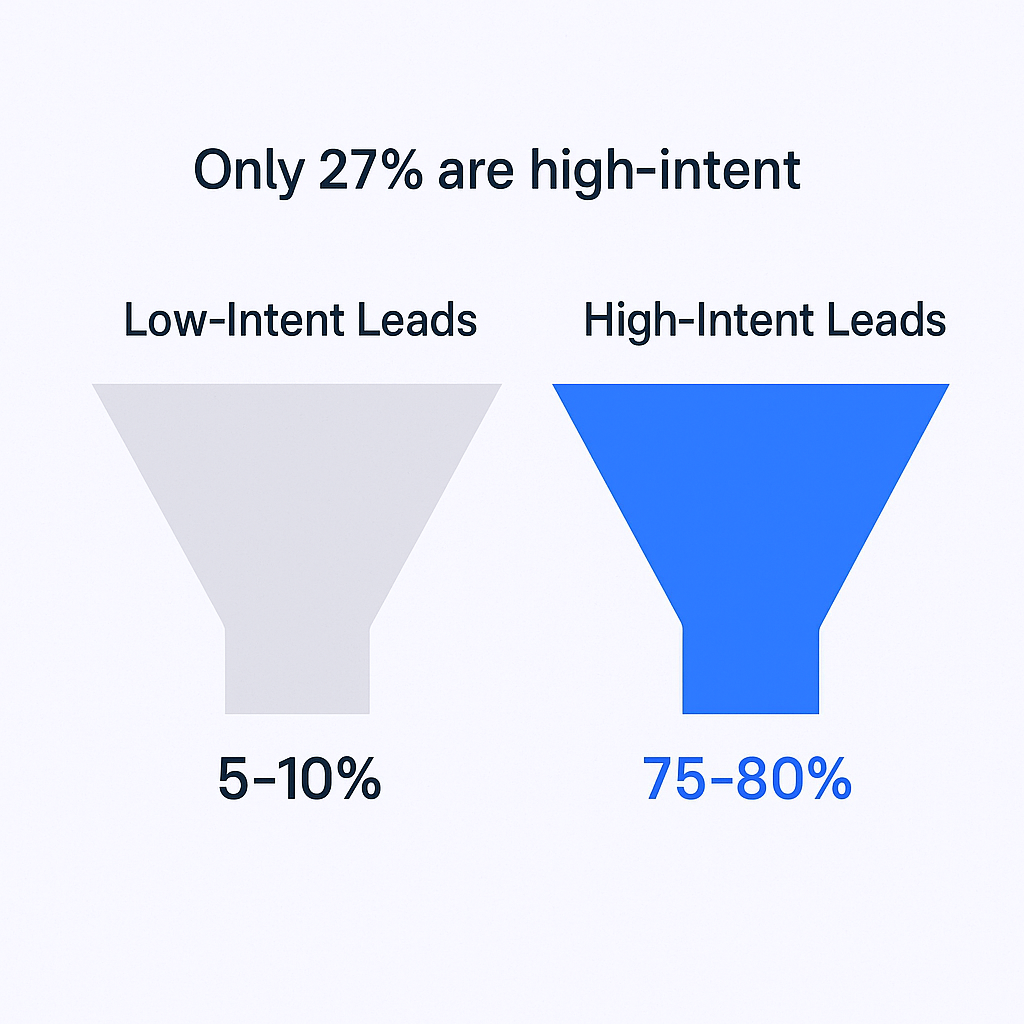
This means most of your pipeline is filled with leads that statistically won’t close. The solution isn’t more volume—it’s better qualification upfront. When reps ask the right discovery questions early, they identify high-intent buyers faster and stop wasting time on dead ends.

If your conversion rate is low, don’t just blame marketing. Look at your qualification process first.

 📊 Boost Conversion With Qualified Leads

Our LinkedIn targeting delivers high-intent prospects who match your ICP—no more

Customer Acquisition Cost (CAC)

CAC is the total cost of acquiring a new customer, including all marketing, advertising, and sales efforts. You calculate it by dividing your total sales and marketing spend by the number of new customers acquired.

The trend is concerning: 54% of sales professionals saw CAC increase over the past year. That’s a direct hit to profitability.

Why is CAC rising? 43% of B2B sales leaders report their sales cycle is getting longer. When deals take more time, they cost more money. Every extra week a deal sits in your pipeline eats into your margins.

The fix: reduce friction in your sales process. Streamline approvals. Improve objection handling. Remove unnecessary steps. Every day you shave off the sales cycle directly reduces CAC.

💰 Cut CAC With Precision Targeting

Stop overspending on unqualified leads. Our LinkedIn campaigns target decision-makers ready to buy, reducing acquisition costs.

Customer Lifetime Value (CLV)

CLV measures the total revenue you expect from a customer over the entire relationship. It’s the counterbalance to CAC.

The rule is simple: CLV must be significantly higher than CAC for your business to be profitable. If you’re spending $10,000 to acquire a customer who only generates $12,000 in lifetime value, you’re in trouble.

Smart teams track the CLV:CAC ratio and aim for at least 3:1. Anything lower means you’re burning cash to grow. Anything higher means you have room to invest more aggressively in acquisition.

CLV also guides retention strategies. A small improvement in customer retention can dramatically boost lifetime value, which gives you more budget to compete for new business.

Average Purchase Value

Average purchase value (or average deal size) tracks the typical revenue per closed deal. It’s a simple metric, but it tells you a lot about your positioning and target market.

Despite all the economic chaos, 93% of respondents indicated that average deal sizes were holding steady or growing. This is surprisingly good news. It means customers are still willing to invest when you demonstrate clear value.

This metric helps you move beyond vanity activity metrics (“I made 100 calls!”) toward revenue impact (“I closed $50K in new business”). It also informs how you segment your sales team and allocate accounts. Reps chasing small deals need different skills and comp structures than those closing enterprise contracts.

Sales Cycle Length

Sales cycle length measures the time from first contact to closed deal. It’s one of the most critical metrics for forecasting and capacity planning.

The bad news: 43% of B2B sales leaders reported an increase in their sales cycle length over the past 12 months. Deals are taking longer to close because buying committees are bigger and decision-making is more complex.

A longer sales cycle directly increases CAC and slows down revenue growth. If a deal is stalling in your pipeline, it usually means one of two things: either it’s not being actively worked, or there’s an unaddressed objection or concern.

On the flip side, a shorter sales cycle often signals strong product-market fit. When customers move quickly, it means you’re solving a painful problem with minimal friction.

âš¡ Shorten Sales Cycles Dramatically

Our outbound campaigns connect you with in-market buyers faster—complete targeting, messaging, and scaling strategies included

Opportunity-to-Win Ratio (Win Rate)

Your win rate is the percentage of opportunities that turn into closed-won deals. It’s the ultimate test of your sales execution.

The numbers are rough:

  • B2B win rates declined 18% year-over-year in 2023
  • They’re down 27% compared to 2021
  • The average B2B sales win rate in 2023 was only 21%
  • For SaaS, it’s slightly better at around 22%

Why are win rates dropping? Complexity. Nearly half of B2B companies (47%) now involve 3 to 5 decision-makers on buying teams. Coordinating that many stakeholders is hard. You need buy-in from finance, legal, end-users, and executives—each with different concerns and priorities.

If your win rate is below 20%, don’t panic. But do analyze your losses. Are you losing on price? Competition? Poor discovery? Misalignment between what you sold and what they needed? The patterns will point to where you need to improve.

Churn Rate

Churn rate measures how many customers cancel or don’t renew. For B2B SaaS, the benchmarks are actually pretty healthy:

  • Average churn rate: 4.67% (Recurly) to 10% (Pacific Crest)
  • Involuntary churn: 0.86% to 1.19% (payment failures)
  • Voluntary churn: 3.36% (active cancellations)

Here’s what most people miss: churn often starts in the sales process, not customer success. If a customer cancels because they didn’t get value, it means the sales team sold them something that didn’t match their needs or set unrealistic expectations.

Voluntary churn is a direct reflection of sales quality. If you’re closing “bad fit” deals just to hit quota, it shows up later as churn. Better qualification upfront prevents this problem and protects your revenue base.

Pipeline Coverage

Pipeline coverage ratio (PCR) measures the value of opportunities in your pipeline against your sales quota. It’s your insurance policy against missing target.

The standard benchmark: 3:1 pipeline coverage. That means if your quarterly quota is $100K, you should have $300K worth of qualified opportunities in your pipeline.

Here’s how to grade yourself:

  • Less than 100% coverage: Poor (you’re in trouble)
  • 100-300% coverage: Average (meeting the 3:1 standard)
  • More than 300% coverage: Healthy (you have cushion)

Pipeline coverage is essential for accurate forecasting and risk management. If your coverage is weak, you can’t afford to lose even one deal. But with healthy coverage, you can absorb losses and still hit quota.

🎯 Build Predictable Pipeline Coverage

Maintain 3:1 coverage consistently with our LinkedIn outbound engine—targeting, campaigns, and scaling handled for you.

7-day Free Trial |No Credit Card Needed.

Track this weekly. It’s your early warning system.

Quota Attainment

We touched on this earlier, but it deserves its own deep dive because quota attainment is the ultimate scorecard.

The breakdown by role:

Role

Median Quota Attainment

Early-stage roles

56.7%

Mid-market sales

42.3%

Enterprise sales

39.4%

As complexity increases, attainment drops. Early-stage roles hit higher numbers because they control more variables—activity volume, skill execution, qualification speed. Enterprise sales face longer cycles, bigger buying committees, and more external factors they can’t control.

This metric directly determines compensation, promotions, and who stays on the team. If you’re not hitting 80%+ consistently, you need to diagnose what’s broken: territory assignment, product-market fit, skill gaps, or market conditions.

How Can Tracking Sales Metrics Improve Sales Performance?

Numbers alone don’t close deals. But when you track the right metrics and act on them, everything changes. Here’s how.

AI-Powered Efficiency Gains

AI isn’t hype anymore—it’s table stakes. 75% of sales teams are projected to be using AI tools by 2025, and the results speak for themselves:

  • 83% of sales teams using AI saw revenue growth, compared to only 66% without AI
  • AI can increase lead generation by up to 50%
  • AI drives an average increase in conversion rates by 25%
  • Companies with defined AI strategies double their revenue growth compared to casual adopters
  • AI can reduce non-selling call time by 60% through automation

Remember that stat from the intro? Sales reps only spend 28% of their time selling. AI sales tools are the solution. They handle note-taking, call summaries, data entry, and follow-up sequencing—giving reps more time for actual conversations.

If you’re not using AI yet, you’re already behind.

Data Quality is Critical

Here’s the catch: AI is only as good as your data. And most sales teams have a data problem.

24% of sales professionals don’t log reliable and consistent meeting data or insights in their CRM. That’s almost a quarter of your team flying blind. And 45% feel overwhelmed by too many tools in their stack.

This creates a “garbage in, garbage out” scenario. If your CRM data is incomplete or inaccurate, your forecasts will be wrong, your AI tools will make bad recommendations, and leadership won’t trust your pipeline.

The fix is simple but not easy: enforce CRM hygiene. Make data entry non-negotiable. Automate where possible. And consolidate your tech stack so reps aren’t jumping between eight different tools.

Coaching and Skill Development

No metric or technology can replace great coaching. The data proves it:

  • Businesses investing in sales training see 50% higher net sales per employee
  • Top performers receive 11 coaching sessions per month, compared to just 3 for average reps
  • Daily sales training can boost conversion rates by 4x (from 2.35% to 9.03%)
  • Top performers are 843% more likely to effectively overcome objections

Think about that last stat. Top performers don’t wing it when prospects push back. They’ve practiced objection handling so many times it’s instinctive. That’s not talent—it’s training.

If you’re a manager, block time every week for coaching. Don’t just review pipeline; role-play tough conversations. Record calls and review them together. Make skill development as important as quota tracking.

Cold Outreach Optimization

Most teams are doing high-volume, low-quality outreach. The numbers expose the problem:

  • Reps average 94.4 activities daily, but spend only 28% of time actually selling
  • Cold email open rates dropped from 36% in 2023 to 27.7% in 2024
  • Cold email response rates sit at 1-5%, though personalization can boost this to 18%
  • The 30/30/50 Rule: success is 30% content quality, 30% list quality, and 50% follow-up strategy
  • Yet 48% of sales reps don’t send a second follow-up message

That last one is wild. Follow-up is half the battle, but most reps give up after one attempt. They’re leaving deals on the table.

The fix: fewer, better emails. Deep personalization. Relentless follow-up. And the right tools to automate without losing the human touch.

Platforms like Salesso help streamline cold outreach by providing verified email addresses and automating follow-up sequences, so reps can focus on personalization and conversations instead of manual grunt work.

Conclusion

The B2B sales environment in 2025 is tougher than ever. 80% of interactions happen digitally. 72% of customer journeys are more complex. Buying committees have 3-5 decision-makers you need to convince. And reps are only selling 28% of the time.

But here’s what winners do differently: they make decisions based on data, not gut feel.

Track these 13 metrics religiously:

  1. Sales Growth
  2. Sales Target Attainment
  3. Sales by Region
  4. Sales by Product
  5. Lead Conversion Rate
  6. Customer Acquisition Cost
  7. Customer Lifetime Value
  8. Average Purchase Value
  9. Sales Cycle Length
  10. Opportunity-to-Win Ratio
  11. Churn Rate
  12. Pipeline Coverage
  13. Quota Attainment

Then act on what you learn. Three things matter most:

Prioritize skill over volume. Top performers get 11x more coaching and convert at 4x the rate. Invest in training.

Embrace AI to buy back time. AI can boost lead gen by 50% and conversion by 25%, but only if your data is clean.

Optimize funnel friction. CAC is rising because sales cycles are lengthening. Reduce friction, improve qualification, and close faster.

Start tracking these metrics today. Identify your biggest gap. Fix it. Then move to the next one.

That’s how you go from missing quota to crushing it.

FAQs

What is sales performance?

Sales performance refers to how effectively a sales team or individual achieves their revenue goals and targets. It's measured through metrics like quota attainment, conversion rates, win rates, and sales cycle length. Strong sales performance means consistently hitting targets while maintaining healthy pipeline coverage and customer retention.

Which sales metric is most important?

It depends on your role and business stage, but quota attainment is the universal "true north" metric. It directly impacts compensation, promotions, and team morale. However, leading indicators like pipeline coverage (3:1 ratio) and lead conversion rates are equally critical because they predict whether you'll hit quota before the quarter ends.

How often should I track sales metrics?

Track activity metrics (calls, emails) in real-time or daily. Review pipeline and conversion metrics weekly to catch trends early. Analyze strategic metrics (CAC, churn, quota attainment) monthly or quarterly. The key is matching your tracking frequency to how fast things change and how quickly you need to course-correct.

What's a good sales conversion rate?

It's context-dependent. Cold call conversion averages 2.35%, but top performers hit 9.03% with training. Cold email response rates run 1-5%, with personalization pushing it to 18%. High-intent leads convert at 75-80%, while low-intent only hit 5-10%. Focus on improving conversion at each stage of your funnel rather than hitting a universal benchmark.

How does AI improve sales performance?

AI boosts performance by automating repetitive tasks and surfacing insights faster. The numbers: 50% increase in lead generation, 25% boost in conversion rates, and 60% reduction in non-selling admin time. AI handles note-taking, email follow-ups, and data entry, giving reps more time for high-value conversations. Companies with defined AI strategies see 2x the revenue growth of those without.

Track Metrics That Actually Close Deals

Our LinkedIn outbound engine targets decision-makers while your team focuses on selling, not prospecting.

Segmentation That Actually Converts

LinkedIn outbound targets precise demographics with strategic campaign design and scaling methods