🎉Find Prospects and Send Cold Emails & LinkedIn Outbound | All in One Place

Shopify Merchant Statistics 2025: The Complete Guide

Table of Contents

Shopify Merchant Statistics 2025: The Complete Guide

  • 4.6 to 5.6 million live Shopify stores operate worldwide as of early 2025 – representing massive growth from just one million merchants in 2019
  • $292.3 billion in gross merchandise volume processed in 2024 – marking a 24% increase from 2023
  • Over $1 trillion in cumulative sales since Shopify’s inception – showing the platform’s massive economic impact
  • United States hosts 2.7+ million stores – representing over 50% of the global total
  • North America accounts for 54% of all merchants – with EMEA at 27% and Asia-Pacific at 14%
  • Apparel category has 520,000+ stores – making it the largest industry category on Shopify
  • 45,650+ domains running on Shopify Plus – with approximately 30,433 distinct merchants at enterprise level
  • Shopify Plus generates 31% of Shopify’s Monthly Recurring Revenue – despite being less than 1% of total merchants
  • 90% of stores generate under $100,000 annually – showing the vast majority are small operations
  • 3% of stores generate over $1 million annually – representing over 100,000+ established, successful businesses
  • 28-29% market share among U.S. ecommerce platforms – giving Shopify the largest share
  • Over 12% of all U.S. ecommerce sales processed through Shopify merchants – demonstrating significant market penetration
  • 85% of Shopify merchants use third-party apps – with over 12,000 apps available in the App Store
  • $11.5 billion in total BFCM 2024 sales – representing a 24% increase from 2023, with peak processing of $4.6 million per minute
  • Average cart value of $108.56 during Black Friday Cyber Monday – showing typical transaction sizes during peak sales periods

The Shopify ecosystem isn’t just an ecommerce platform; it’s a global economic powerhouse. With over 4.6 million live stores worldwide and a staggering $292.3 billion in gross merchandise volume, this platform has created opportunities for entrepreneurs and businesses across every industry.

Whether you’re exploring ecommerce trends, analyzing market share dynamics, or looking to understand the commercial landscape, these statistics reveal why Shopify has become the backbone of modern digital commerce. From small startups to enterprise brands, millions of entrepreneurs rely on this platform to accept payments online and build thriving businesses.


This comprehensive guide breaks down the most important Shopify merchant statistics you need to know in 2025, giving you actionable insights into market opportunities, geographic trends, and revenue patterns that define today’s ecommerce landscape.

How do we collect this data?

The statistics in this report come from multiple authoritative sources to ensure accuracy and reliability. We’ve synthesized data from:

Official Shopify Financial Disclosures: Direct information from Shopify’s quarterly and annual reports to shareholders, providing verified figures on revenue, gross merchandise volume, and merchant solutions.

Leading Ecommerce Intelligence Platforms: Comprehensive data from industry-leading firms like StoreLeads, BuiltWith, and Backlinko, which track millions of live websites to provide detailed breakdowns of store counts, technology usage, and industry distributions.

Global Market Research: Insights from respected organizations like Statista and Digital Commerce 360, contextualizing Shopify’s position within the broader ecommerce landscape.

This multi-source approach ensures you’re getting a complete, verified picture of the Shopify ecosystem that you can confidently use for strategic planning and market analysis.

Top 8 Shopify Merchant Statistics

The Big Picture: Millions of Stores Creating a Multi-Billion Dollar Economy

Understanding the true scale of the Shopify ecosystem begins with grasping the sheer number of active participants and the economic value they generate.

Key Statistics:

  • 4.6 to 5.6 million live Shopify stores operate worldwide as of early 2025
  • $292.3 billion in gross merchandise volume processed in 2024 (24% increase from 2023)
  • Over $1 trillion in cumulative sales since Shopify’s inception

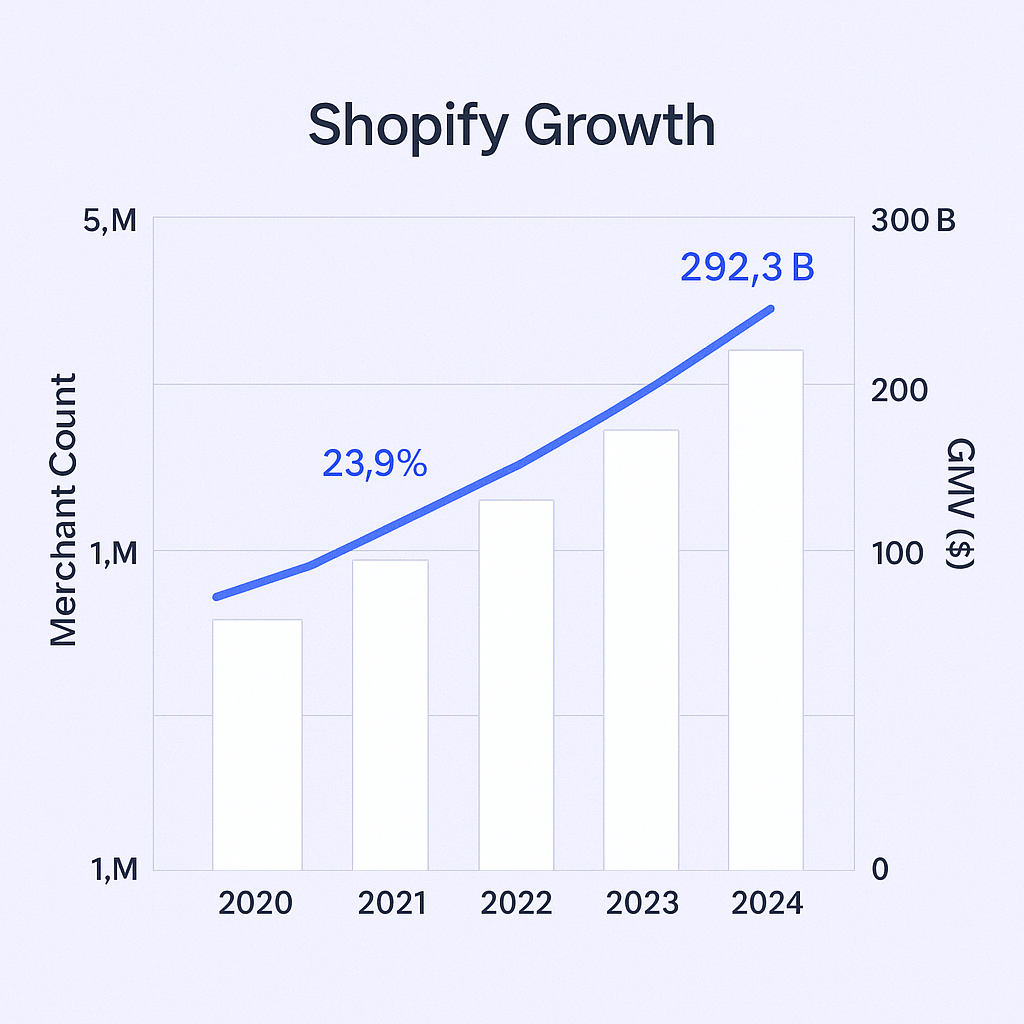
The growth trajectory tells a compelling story. From just one million merchants in 2019, the platform has exploded to nearly five times that size. More importantly, the gross merchandise volume has been growing even faster than merchant count, consistently hitting over 20% year-over-year growth.

This divergence reveals a critical insight: the average Shopify store is becoming more successful over time. As these businesses mature, they generate higher revenues, making them increasingly valuable participants in the digital economy.


Year

Merchants

Annual GMV

GMV Growth

2020

1.7M

$119.6B

+95.7%

2021

2.1M

$175.4B

+46.6%

2022

~2.5M

$197.3B

+12.5%

2023

~2.3M

$235.9B

+19.6%

2024

~4.6M+

$292.3B

+23.9%


Geographic Distribution: Where the Opportunities Are Located

Not all markets offer equal opportunities. The geographic distribution of Shopify merchants reveals clear patterns that can guide market entry and expansion strategies.

Market Leadership:

  • United States: 2.7+ million stores (over 50% of global total)
  • United Kingdom: 205,000+ stores
  • Australia: 149,000+ stores
  • Canada: 108,000+ stores
  • Germany: 118,000+ stores
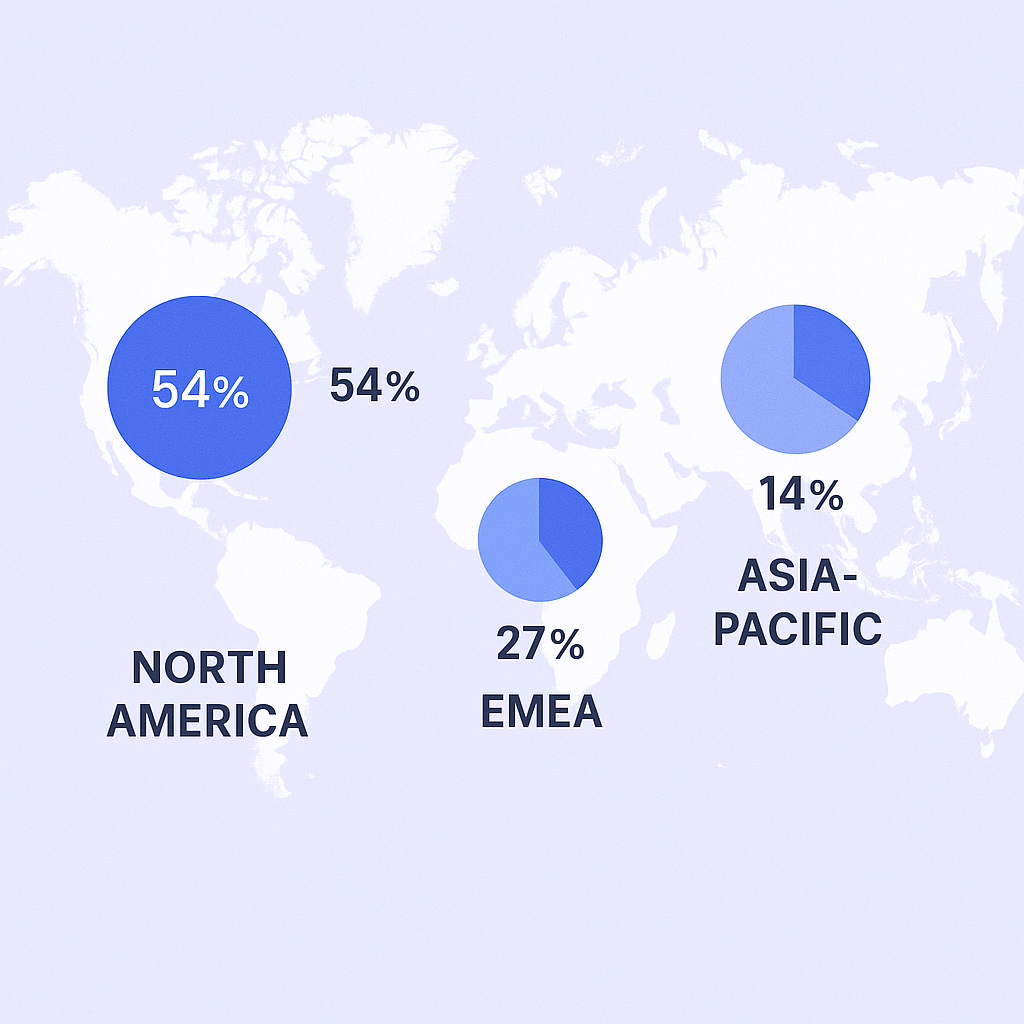
Regional Breakdown:

  • North America: 54% of all merchants
  • EMEA (Europe, Middle East & Africa): 27%
  • Asia-Pacific: 14%

The dominance of English-speaking markets is notable, with the top four countries all sharing this characteristic. These markets represent the most mature and competitive ecommerce environments globally, suggesting merchants here face intense competition and need sophisticated tools to maintain their edge.

Rank

Country

Live Stores

1

United States

2,722,779

2

United Kingdom

205,526

3

Australia

149,729

4

Brazil

135,528

5

Germany

118,506

6

Canada

108,075

7

France

63,317

8

India

58,394

9

Netherlands

47,895

10

Italy

43,865

Understanding these geographic concentrations helps identify where the highest-value opportunities exist and where competition for merchant attention will be most intense.

🎯 Ready to Reach These Merchants?

 Our LinkedIn outbound engine targets Shopify owners by geography, revenue, and industry with surgical precision

Industry Analysis: The Verticals Driving Ecommerce Growth

Different industries present vastly different opportunities and challenges within the Shopify ecosystem. Understanding these vertical distributions reveals where the biggest markets exist.

Top Industry Categories:

  • Apparel: 520,000+ stores (largest category)
  • Home & Garden: 229,000+ stores
  • Beauty & Fitness: 198,000+ stores
  • Food & Drink: 124,000+ stores

The apparel category’s dominance reflects both the industry’s natural fit for ecommerce and the intense competition within fashion retail. This sector requires sophisticated inventory management, visual merchandising tools, and marketing automation to succeed.

Beyond raw numbers, product complexity offers another lens for analysis. While over 620,000 stores sell fewer than 10 products, hundreds of thousands manage inventories of 100+ products, with tens of thousands selling 1,000+ SKUs.

This product count variation directly correlates with operational complexity. A store managing 1,500 electronic components faces fundamentally different challenges than one selling five handmade items. The larger operation requires advanced inventory management, supplier coordination, and sophisticated customer service capabilities.

Enterprise Focus: The High-Value Shopify Plus Segment

For businesses targeting enterprise clients, Shopify Plus represents the premium tier where the most valuable opportunities exist.

Shopify Plus Key Metrics:

  • 45,650+ domains running on Shopify Plus
  • Approximately 30,433 distinct merchants at enterprise level
  • 31% of Shopify’s Monthly Recurring Revenue despite being less than 1% of merchants
  • Average growth rate of 126% year-over-year for merchants with $1M-$500M revenue

Notable Shopify Plus merchants include Fashion Nova, SKIMS, Steve Madden, and Stanley 1913. These brands represent the platform’s ability to scale with businesses as they grow from startups to major enterprises.

The decision to upgrade to Shopify Plus (starting at $2,300/month) signals serious growth intentions. Companies making this investment are actively seeking tools and services to support their expansion, making them prime targets for B2B solutions.

🚀 Connect with Shopify Plus Enterprises

Complete targeting strategy to reach 30K+ enterprise merchants with campaign design that converts

Revenue Segmentation: Following the Money Trail

Understanding the revenue distribution among Shopify stores reveals where the real opportunities exist for B2B service providers.

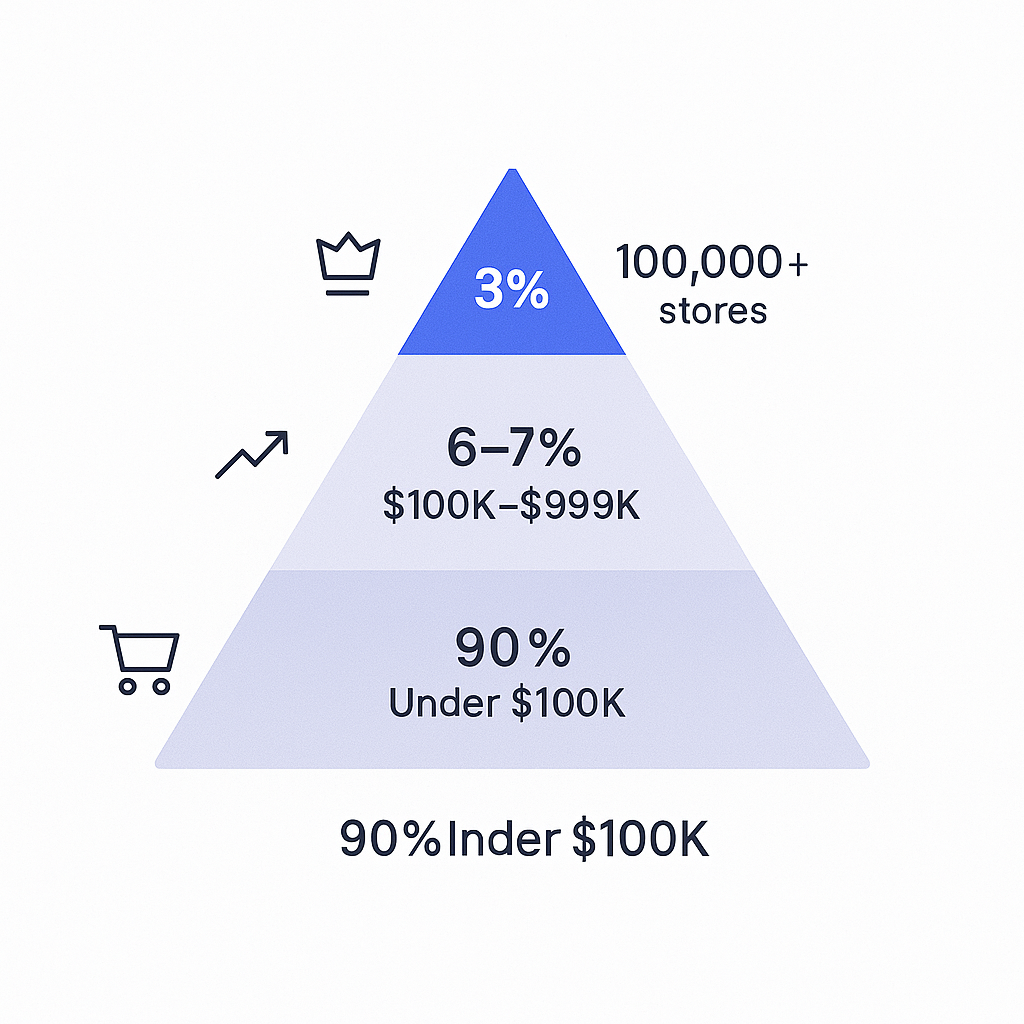
Revenue Distribution:

  • 90% of stores generate under $100,000 annually
  • 6-7% fall in the $100,000-$999,000 range
  • 3% generate over $1 million annually

While the percentages seem small, the actual numbers are substantial. That 3% of million-dollar stores represents over 100,000+ established, successful businesses with significant operational needs and budgets for professional services.


The revenue tiers correlate directly with business needs:

Sub-$100k stores focus primarily on customer acquisition and basic marketing needs. These businesses typically require fundamental tools and cost-effective solutions.

$100k-$999k stores have moved beyond survival into scaling mode. They face automation challenges, need better customer retention strategies, and require analytics to optimize their marketing spend.

$1M+ stores deal with enterprise-level complexity: multi-channel inventory management, international tax compliance, sophisticated customer data platforms, and advanced business intelligence needs.

💰 Target Your Ideal Revenue Tier

LinkedIn outbound campaigns designed to reach $100K-$1M+ Shopify merchants actively seeking solutions

Market Dominance: Why Shopify Leads the Pack

Shopify’s position in the broader ecommerce platform landscape demonstrates why it’s become the platform of choice for serious merchants.

Market Share Statistics:

  • 28-29% market share among U.S. ecommerce platforms (largest share)
  • Over 12% of all U.S. ecommerce sales processed through Shopify merchants
  • Dominant platform among top 1 million high-traffic websites globally

This market dominance creates a powerful ecosystem effect. The Shopify App Store hosts over 12,000 apps, creating a rich marketplace for specialized tools and services. This robust ecosystem makes the platform even more attractive to new merchants, who choose Shopify specifically for its extensive third-party integrations and support network.

The platform’s success in capturing high-value merchants (rather than just high quantities of small sites) demonstrates its effectiveness in serving businesses that actually generate significant revenue.

Technology Adoption: Reading the App Install Signals

The apps that Shopify merchants install provide valuable insights into their priorities, challenges, and growth stage.

App Usage Patterns:

  • 85% of Shopify merchants use third-party apps
  • 12,000+ apps available in the App Store Shopify
  • Most popular categories among successful merchants: email marketing (Klaviyo), product reviews (Judge.me), customer service (Gorgias)

App installations serve as powerful buying signals. When a merchant installs a competitor’s tool, they’ve already identified a problem, decided to invest resources in solving it, and actively evaluated solutions. This makes them highly qualified prospects for alternative solutions.

Popular app categories among Shopify Plus merchants reveal common pain points:

  • Email marketing and SMS automation
  • Product review management
  • Customer service and helpdesk solutions
  • Inventory management tools
  • Analytics and reporting platforms

âš¡ Beat Your Competitors to Prospects

Our LinkedIn targeting finds Shopify merchants before they choose competitor solutions and scales proven campaigns

7-day Free Trial |No Credit Card Needed.

Peak Performance Indicators: Black Friday Cyber Monday Insights

Black Friday Cyber Monday performance provides crucial insights into merchant capabilities and growth trajectories.

2024 BFCM Performance:

  • $11.5 billion in total sales (24% increase from 2023)
  • Peak processing rate of $4.6 million per minute
  • Average cart value of $108.56

Successfully executing a BFCM strategy requires significant planning, infrastructure, and operational sophistication. Merchants who actively participate in and promote major sales events demonstrate:

  • Advanced inventory management capabilities
  • Sophisticated marketing campaign execution
  • Robust technical infrastructure to handle traffic spikes
  • Professional customer service operations
  • Strategic business planning and growth orientation

Monitoring merchant behavior around major commercial events like Black Friday Cyber Monday provides valuable intelligence about their operational maturity and growth ambitions. Brands that heavily invest in BFCM campaigns are typically the most organized and ambitious operators in their respective markets.

The sustained year-over-year growth in BFCM performance also indicates the increasing sophistication of the overall Shopify merchant ecosystem, with more businesses developing the capabilities to participate effectively in major sales events.

Wrap Up

The Shopify ecosystem represents one of the largest and most dynamic commercial platforms in the world. With 4.6+ million active stores generating $292 billion in annual gross merchandise volume, it’s created unprecedented opportunities for businesses across every industry and geography.

The key insights from these statistics reveal several important trends:

Market Maturation: The average Shopify store is becoming more successful over time, as evidenced by GMV growing faster than merchant count. This creates an environment where businesses have increasing budgets for sophisticated tools and services.

Geographic Concentration: The “Big 5” markets (US, UK, Australia, Canada, Germany) represent the highest concentration of valuable prospects, particularly in mature, competitive markets where merchants need advanced solutions to maintain their edge.

Revenue Segmentation: While 90% of stores generate under $100k annually, the 3% earning over $1M represent 100,000+ established businesses with significant operational complexity and service budgets.

Enterprise Opportunities: Shopify Plus merchants, while representing less than 1% of total stores, generate 31% of platform revenue and are growing at 126% annually, indicating massive expansion needs.

Technology Integration: With 85% of merchants using apps and 12,000+ available solutions, the ecosystem provides multiple entry points for B2B service providers to connect with prospects.

Whether you’re analyzing market opportunities, planning geographic expansion, or developing solutions for ecommerce merchants, these statistics provide the foundation for data-driven decision making in one of the world’s fastest-growing commercial ecosystems.

FAQs

How many Shopify stores are there in 2025?

There are approximately 4.6 to 5.6 million live Shopify stores worldwide as of early 2025, representing massive growth from just 1 million merchants in 2019.

What is Shopify's market share?

Shopify holds a 28-29% market share among U.S. ecommerce platforms, making it the largest platform by market share. Shopify merchants also account for over 12% of all U.S. ecommerce sales.

How much money do Shopify merchants make?

Revenue varies significantly: 90% of stores generate under $100,000 annually, 6-7% earn $100,000-$999,000, and 3% generate over $1 million per year. The top tier represents over 100,000 highly successful businesses.

What countries have the most Shopify merchants?

The United States leads with 2.7+ million stores, followed by the United Kingdom (205,000+), Australia (149,000+), Canada (108,000+), and Germany (118,000+).

What is Shopify Plus and how many merchants use it?

Shopify Plus is the enterprise-level solution for high-growth businesses, with approximately 30,433 distinct merchants. Despite being less than 1% of total merchants, they generate 31% of Shopify's recurring revenue.

Target Shopify Merchants on LinkedIn

Reach 4.6M+ decision-makers with precision targeting and proven campaign strategies

Segmentation That Actually Converts

LinkedIn outbound targets precise demographics with strategic campaign design and scaling methods

How to Build a High-Converting B2B Sales Funnel from Scratch on LinkedIn ​