
The digital shopping landscape has transformed beyond recognition. What started as a convenience has become the backbone of global retail, reshaping how billions of people discover, evaluate, and purchase products.
If you’re trying to understand where the market is heading, you’re in the right place. These online shopping trends statistics reveal the forces driving ecommerce growth and the behaviors that define today’s digital consumers.
Important Online Shopping Statistics
Let’s start with the numbers that matter most:
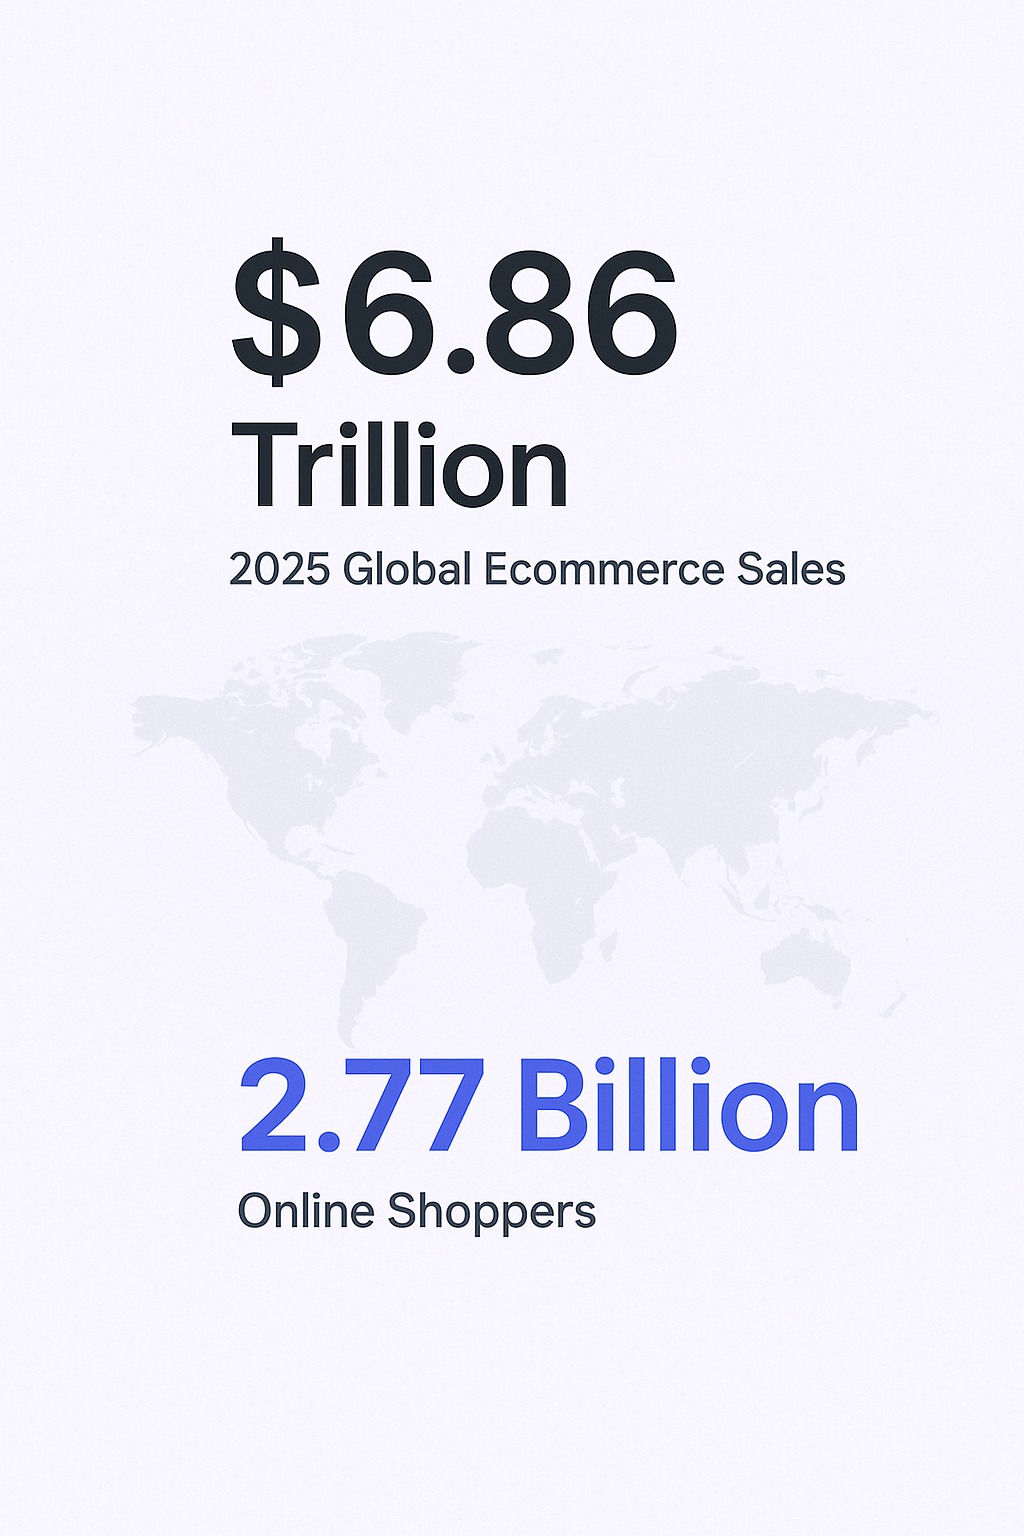
- Global ecommerce sales will hit $6.86 trillion in 2025
- 2.77 billion people shop online worldwide (33% of global population)
- 21% of all retail purchases happen online
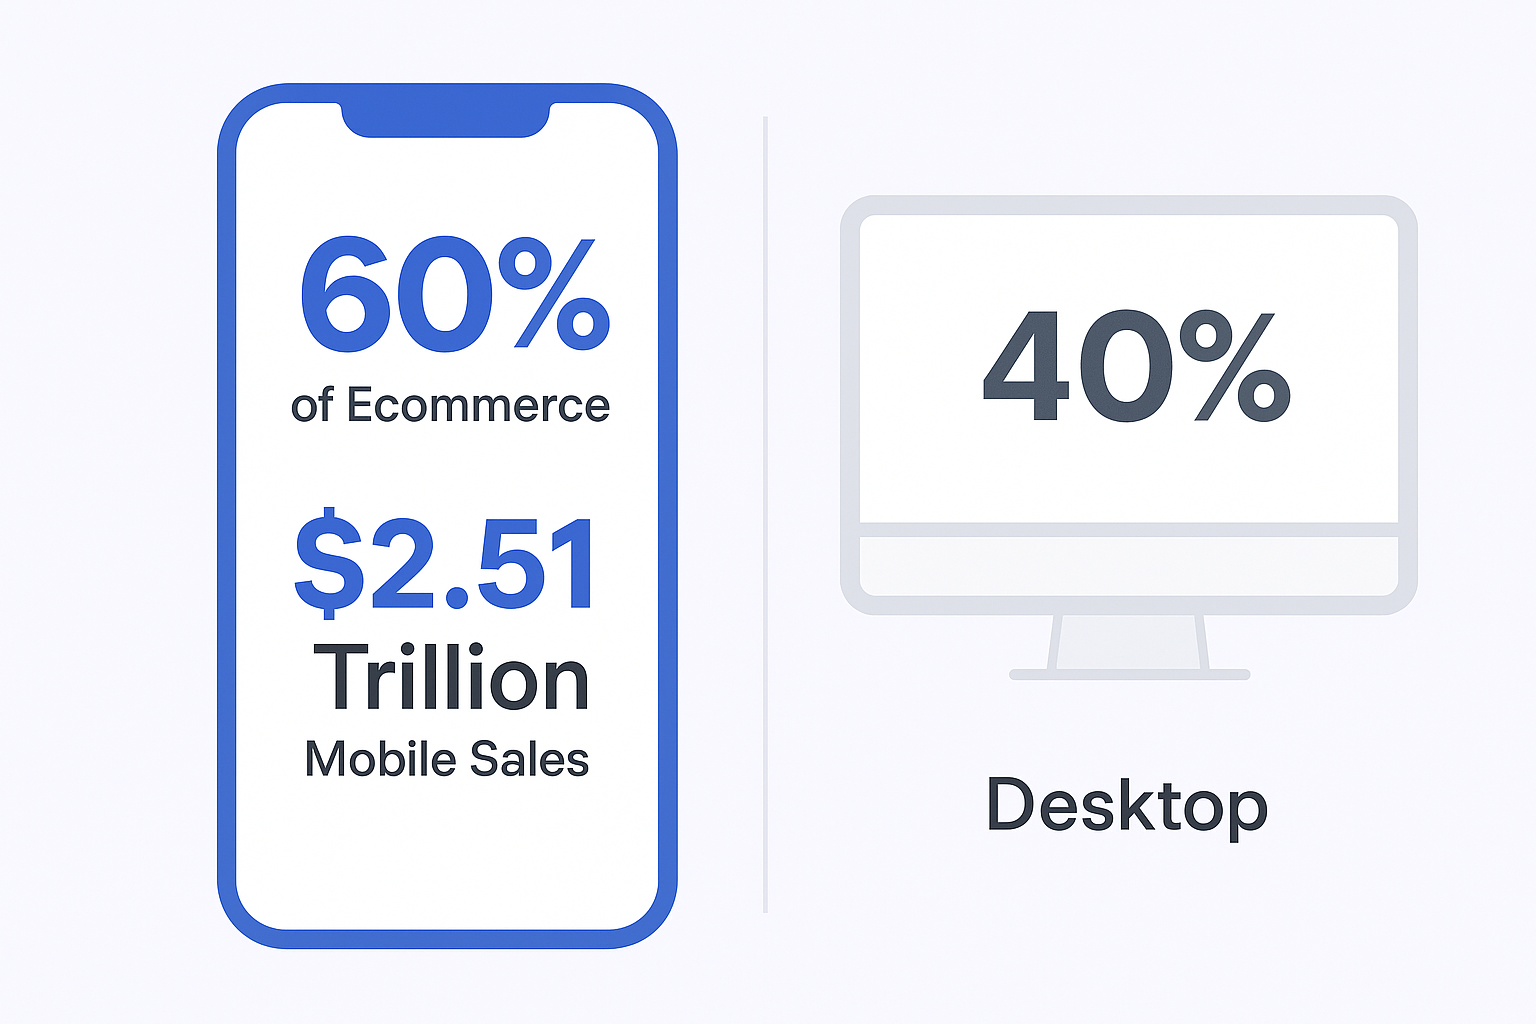
- Mobile commerce accounts for 60%+ of ecommerce sales
- Average cart abandonment rate sits at 70%
- Ecommerce conversion rates
- range from 2.5% to 3.35%
These figures paint a clear picture: online shopping isn’t just growing—it’s dominating. The sheer scale represents both massive opportunity and intense competition.
General Online Shopping Statistics
The ecommerce engine shows no signs of slowing down. Global ecommerce is projected to grow at 8.6% in 2025, driven primarily by existing customers spending more rather than new shopper acquisition.
Here’s what’s particularly interesting: while ecommerce sales grow at 8.6%, new online shoppers only increase by 2.2%. This gap reveals a critical shift—the market is maturing from customer acquisition to customer value optimization.
By 2033, ecommerce will generate $10 trillion annually. Looking even further ahead, some projections suggest 95% of all purchases will be ecommerce-driven by 2040.
The United States remains a powerhouse, with online shopping expected to reach $1.29 trillion in 2025 and climb to $2.5 trillion by 2030.
Global E-Commerce Trends by Country
Different regions show varying adoption patterns and growth trajectories:
United States: Nearly 285 million online shoppers by 2025, representing one of the world’s most mature digital markets.
Asia-Pacific: Continues to lead in mobile-first shopping behaviors, with several countries seeing mobile commerce exceed 70% of total ecommerce.
Europe: Strong growth in cross-border shopping, with consumers increasingly comfortable purchasing from international retailers.
The annual growth rate varies significantly by region, with emerging markets often showing double-digit growth while mature markets focus on increasing transaction values.
Top Leading E-Commerce Stores
The ecommerce landscape is dominated by several key players, though the competitive dynamics continue to evolve:
Amazon maintains its position as the global leader, though its market share varies significantly by region and product category.
Social commerce platforms are emerging as serious contenders, with TikTok, Instagram, and Facebook collectively driving billions in sales.
Specialized marketplaces continue to thrive in specific verticals, from fashion to electronics to groceries.
The rise of direct-to-consumer brands has also reshaped the competitive landscape, with many companies building substantial businesses by selling directly through their own platforms.
Demographic Insights on Online Shoppers
Understanding who shops online—and how they behave—is crucial for anyone operating in digital commerce.
Generation Z: The Digital Natives
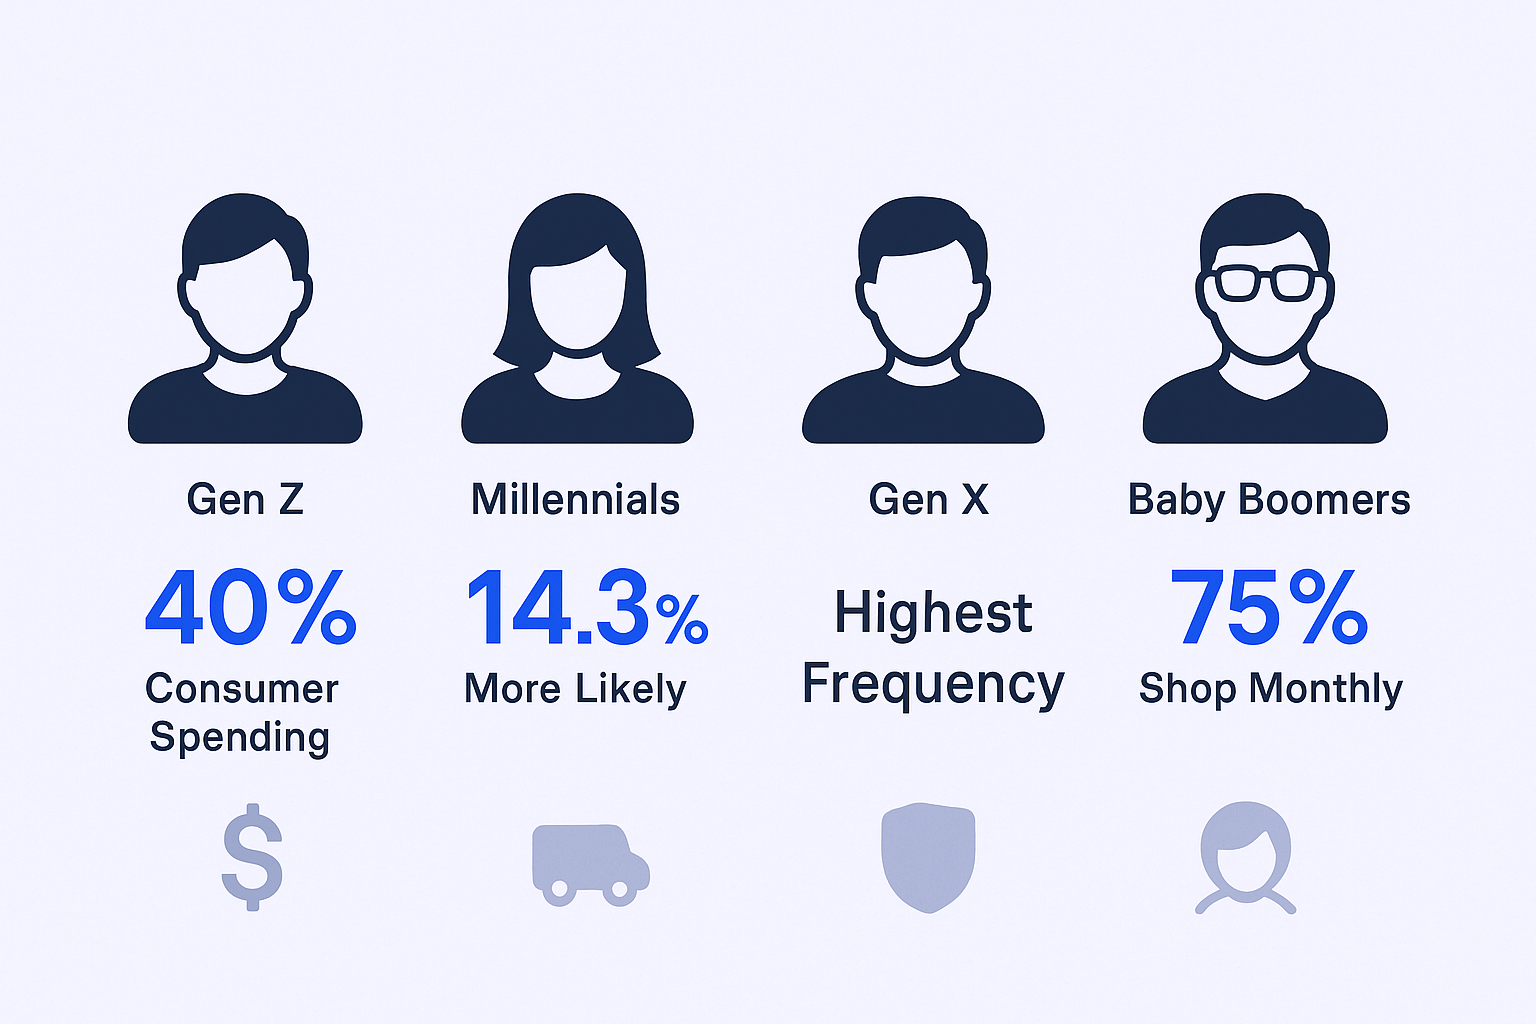
Gen Z controls 40% of all consumer spending and their influence continues to grow. 85% discover new products through social media, making platforms like TikTok and Instagram essential discovery channels.
96% of Gen Z make at least one smartphone purchase monthly, and 66% wait for discounts before buying. They’re also driving the secondhand economy, with 42% actively participating in resale shopping.
Millennials: The Power Shoppers
Millennials represent the core of modern ecommerce. They’re 14.3% more likely than other generations to do most of their shopping online and are the only demographic that explicitly prefers digital over in-store experiences.
65% of U.S. millennials have shopped for groceries online, and they’ve been early adopters of Buy Now, Pay Later services.
Gen X and Baby Boomers: The Consistent Buyers
Gen X shows the highest frequency of online shopping, with many making purchases daily or weekly. 75% of U.S. Baby Boomers shop online at least monthly, proving that people shop online across all age groups.
Income-Level Impact
High-income households (>$100k) are 12.3% more likely to shop online than middle-income counterparts. They prefer established payment methods: 34% use PayPal, 31% use credit cards.
Lower-income households show more price sensitivity and caution, being more likely to perceive digital transaction risks.
Frequency of Online Shopping
Shopping frequency varies dramatically by demographic and product category:
- Daily shoppers: Primarily Gen X consumers making routine purchases
- Weekly shoppers: Mix of all demographics, often for groceries and household items
- Monthly shoppers: Most common pattern across all age groups
- Occasional shoppers: Typically for big-ticket items or seasonal needs
72% of women make online purchases at least monthly, compared to 68% of men. However, men show slightly higher preference for browsing online (53% vs 44%).
Mobile Shopping Trends
Mobile commerce represents the future of online retail. Mobile commerce will generate $2.51 trillion in 2025, with smartphones driving more than 60% of all ecommerce transactions.
70% of shoppers identify their smartphone as their primary device for online shopping. 74% of consumers are more likely to return to businesses with mobile-friendly sites.
However, there’s a significant challenge: mobile conversion rates average just 0.55%, substantially lower than desktop. Mobile cart abandonment reaches 84-85.65%, indicating massive friction in the mobile shopping experience.
This “Mobile Paradox” represents both a major challenge and opportunity—high traffic and intent, but poor conversion performance.
