- blog
- Statistics
- Ecommerce Return Statistics 2024: Ultimate Guide & Insights
Table of Contents
Ecommerce Return Statistics
- $890 billion worth of merchandise is returned annually – representing nearly 17% of all retail sales
- Average ecommerce return rate sits at 16.9% – though some studies place it as high as 24.5%, meaning roughly 1 in 4 items purchased online are returned
- Online purchases are returned at nearly 3x the rate of in-store purchases – due to customers being unable to touch, try, or fully examine products before buying
- Returning a $100 item can cost businesses $20-65 beyond the refund – including reverse logistics, processing labor, and inventory depreciation
- Return fraud costs retailers $104 billion annually – representing 15.1% of all returns involving some form of fraud
- Returns generate 24 million metric tons of CO2 emissions annually – with billions of pounds of returned merchandise ending up in landfills
- 67% of shoppers actively check the returns page before making a purchase decision – making return policy a crucial conversion tool
- 76% of consumers consider free return shipping essential – no longer just a nice-to-have feature
- 67% of customers won’t shop with you again after a negative return experience – showing the critical importance of the return process for customer retention
- 52-56% of returns are due to damaged or defective items – the top preventable reason for returns
- 50% of returns are because items didn’t fit – the leading customer preference reason
- 51% of Gen Z shoppers intentionally buy multiple sizes/colors to return unwanted items – with 36% of Gen X and 24% of Baby Boomers also engaging in “bracketing”
- 62% of shoppers prefer “buy online, return in-store” options – showing the value of omnichannel return capabilities
- 23-37% of returns are due to wrong item being sent – another major preventable issue
- Fashion retailers regularly see return rates between 20-40% – while beauty products hover around 4.3%
Returns are the hidden profit killer in ecommerce. While you’re celebrating another sale, $890 billion worth of merchandise is being returned annually – that’s nearly 17% of all retail sales. But here’s the thing: smart businesses are turning this challenge into a competitive advantage.
Whether you’re running a small online store or managing enterprise ecommerce, understanding return statistics isn’t just about damage control. It’s about identifying opportunities to improve customer experience, reduce costs, and build a more profitable business.
Let’s dive into the numbers that matter and discover what they mean for your bottom line.
What Is the Average Return Rate for Ecommerce?
The average ecommerce return rate sits at 16.9% according to the National Retail Federation (NRF), though some studies place it as high as 24.5%. This means roughly 1 in 4 items purchased online finds its way back to the seller.
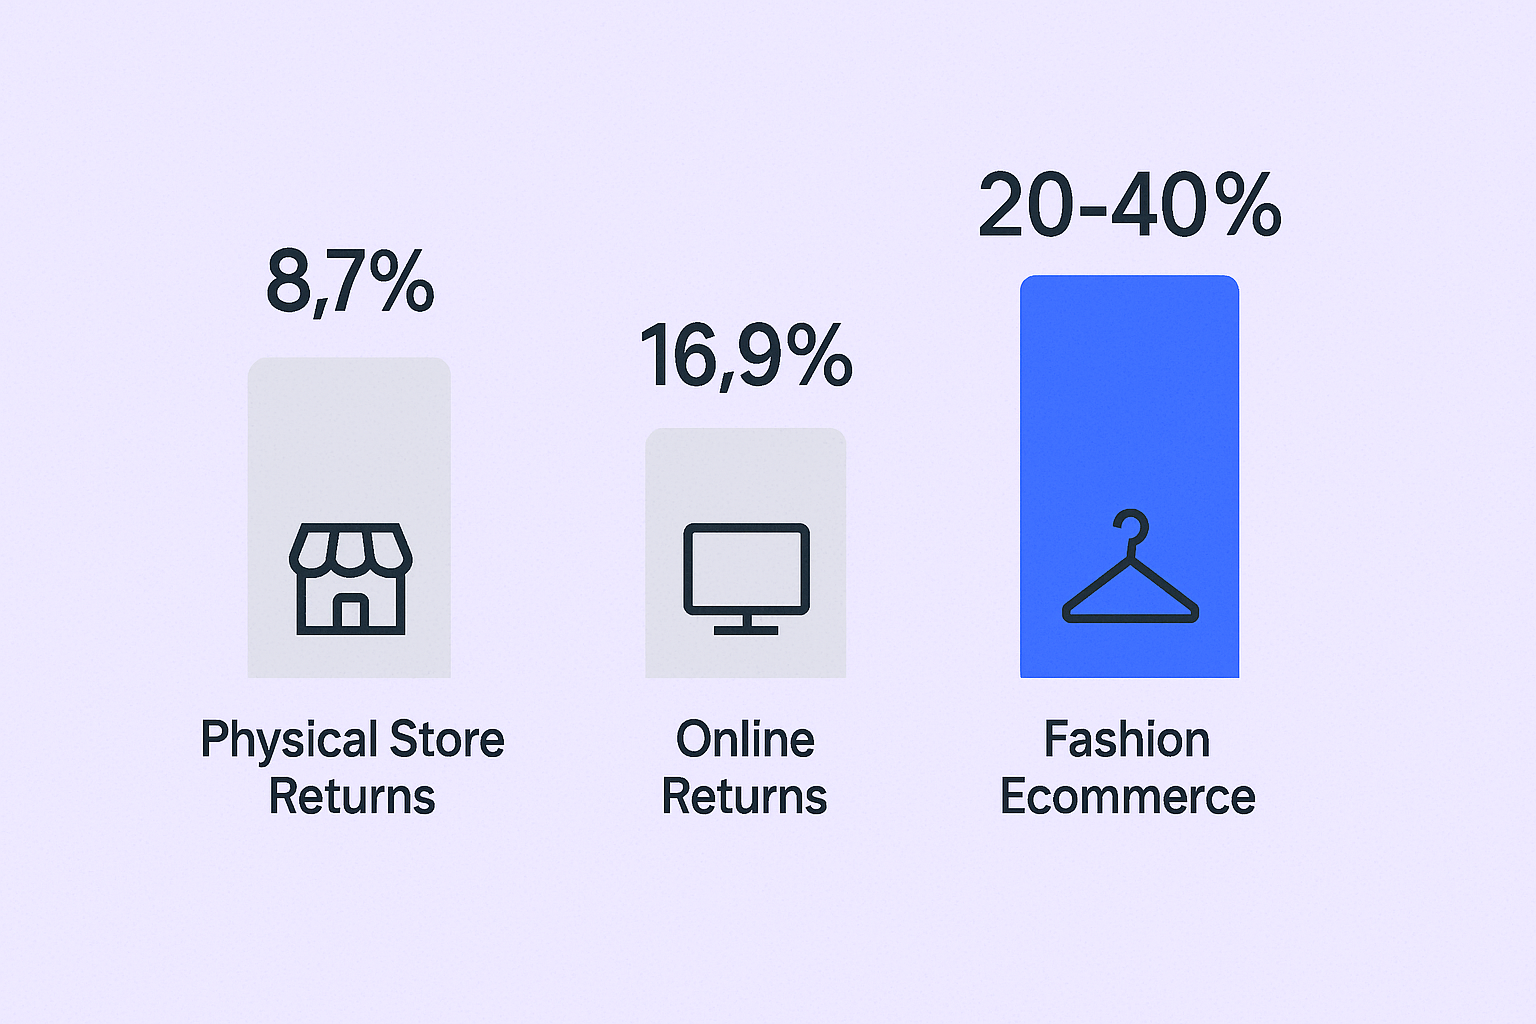
To put this in perspective, online purchases are returned at nearly 3 times the rate of items bought in physical stores. The reason? Customers can’t touch, try, or fully examine products before buying online.

Key benchmarks to remember:
- Average return rate: 16.9% – 24.5%
- Holiday season spike: Additional 17% increase
- In-store vs online: Physical stores see only 8.7% return rate
The variation in these numbers often depends on your industry, product type, and customer demographics. Fashion retailers, for instance, regularly see return rates between 20-40%, while beauty products hover around 4.3%.
How Much Do Returns Cost Ecommerce Brands?
Returns aren’t just about refunding the purchase price. The hidden costs can eat up 20% to 65% of the item’s original value.
Â

Â
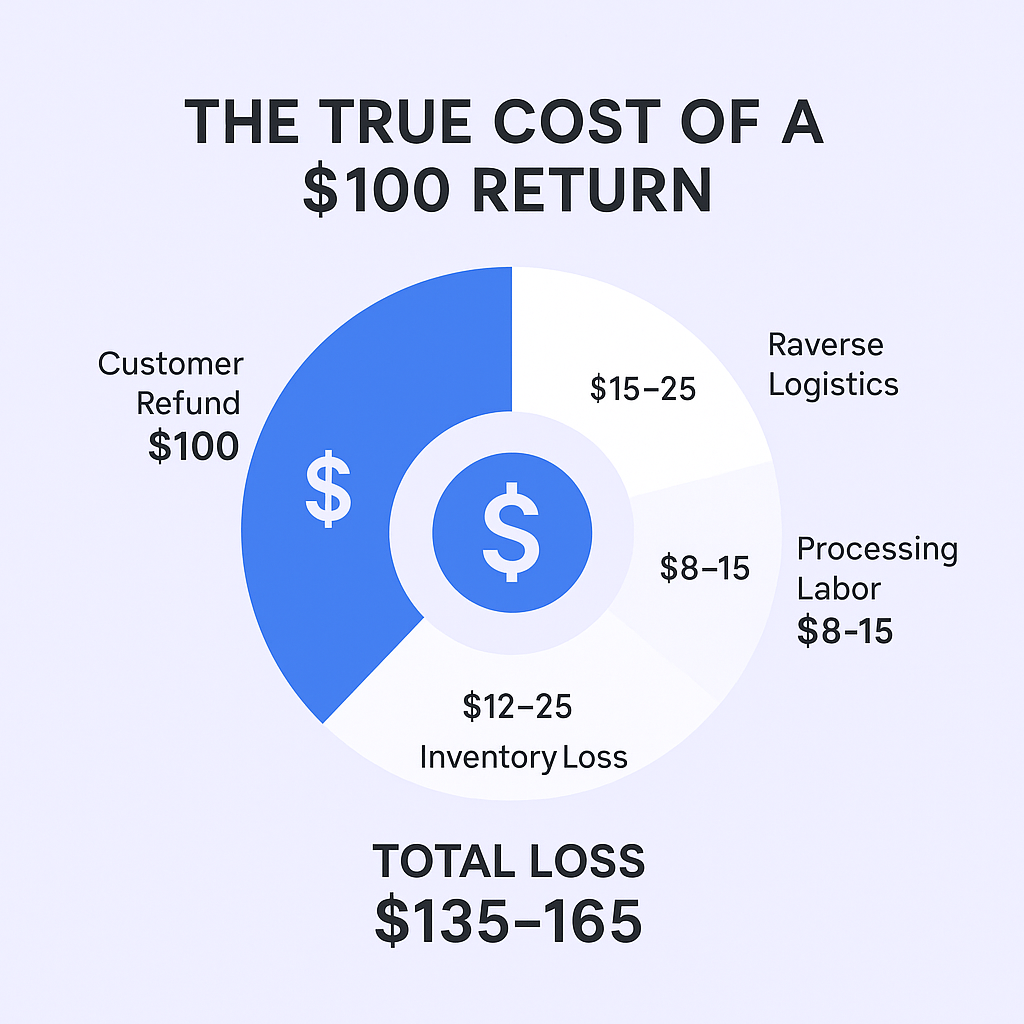
The true cost breakdown includes:
- Reverse logistics: Return shipping and handling
- Processing labor: Inspection, restocking, customer service
- Inventory depreciation: Many returned items can’t be resold at full price
- Return fraud: Costing retailers $104 billion annually
For context, if you sell a $100 item that gets returned, you might lose $20-65 beyond just the refund. Multiply that across thousands of transactions, and you’re looking at serious profit erosion.
🎯 Sell To Brands Losing $65 Per Return
Our LinkedIn outbound targets ecommerce companies with proven return pain points and budget authority
Environmental impact adds another layer:
- Returns generate 24 million metric tons of CO2 emissions annually
- Billions of pounds of returned merchandise end up in landfills
- Transportation costs double when items make a round trip
Smart businesses are factoring these costs into their pricing strategies and investing in return prevention technologies.
Return Policies in Ecommerce
Your return policy isn’t just fine print – it’s a conversion tool. 67% of shoppers actively check the returns page before making a purchase decision.
Essential policy elements that convert:
- Clear return window: 30 days is the standard expectation
- Free return shipping: 76% of consumers consider this essential
- Easy process: Complicated returns drive customers away permanently
- Exchange incentives: Bonus store credit can retain revenue
Strategic policy considerations:
- Seasonal adjustments: Extend windows during holidays
- Category-specific rules: Different products need different approaches
- Omnichannel options: 62% of shoppers prefer “buy online, return in-store”
Remember: 67% of customers won’t shop with you again after a negative return experience. Your policy and process can make or break customer lifetime value.
📊 Reach 67% Of Brands Losing Customers
Target ecommerce decision-makers actively seeking return solutions through precision LinkedIn campaigns
Why Do People Return Items?
Understanding return reasons helps you prevent them. The data reveals clear patterns between preventable issues and customer preferences.
Â

Â
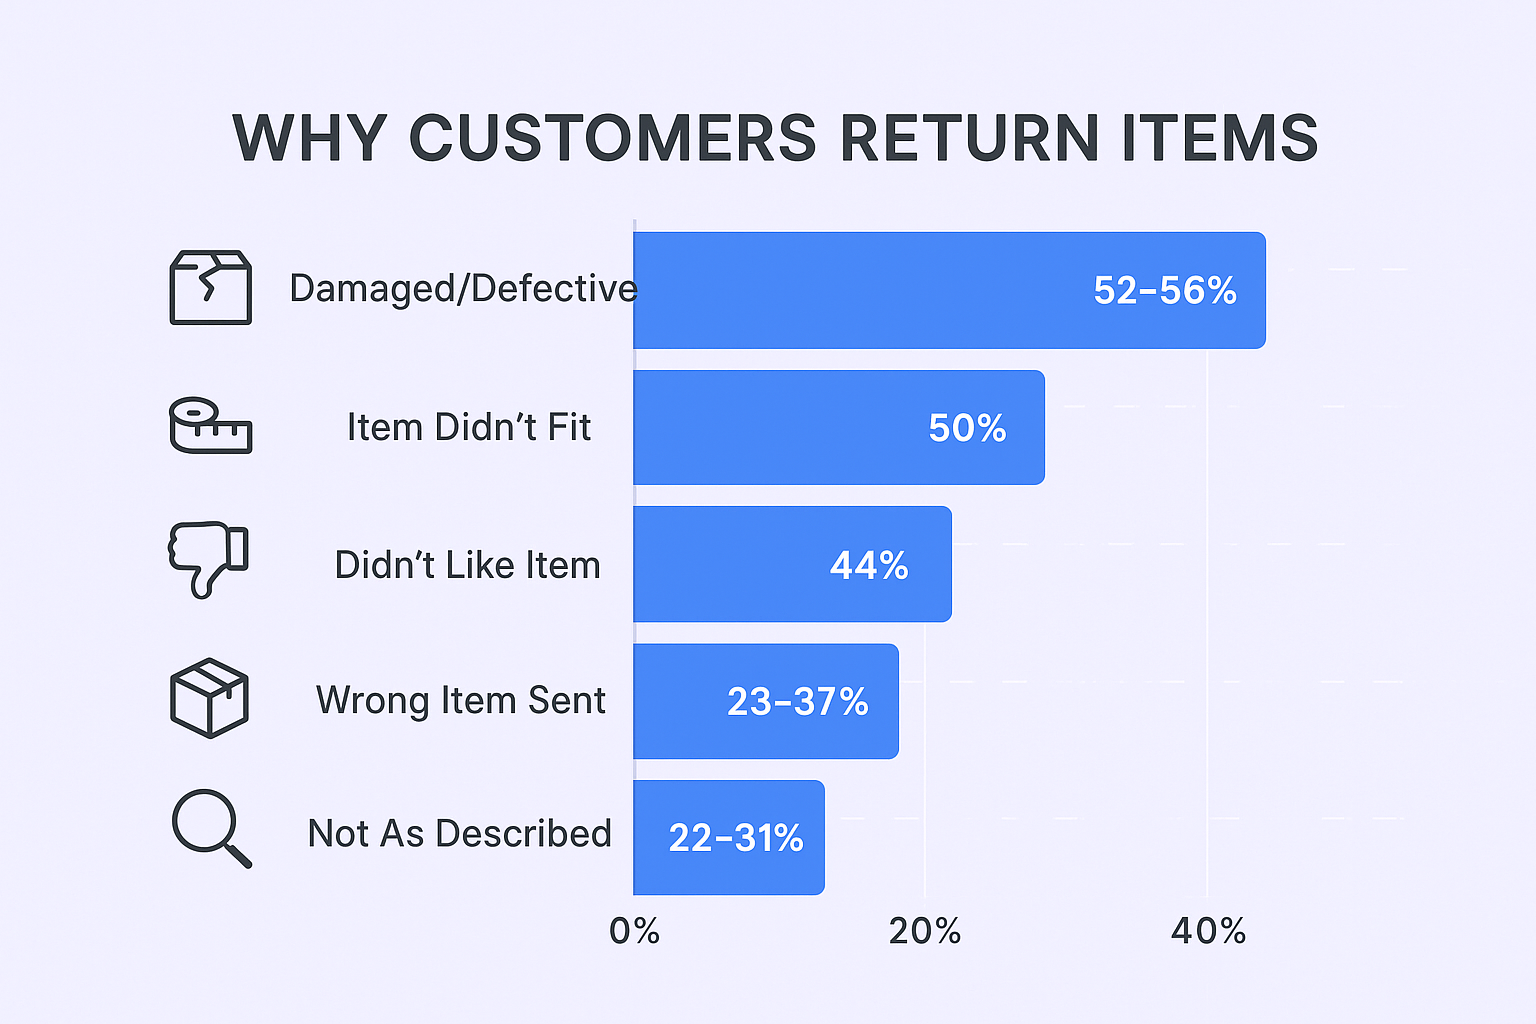
Retailer-fault returns (preventable):
- Damaged or defective items: 52-56%
- Wrong item sent: 23-37%
- Item not as described: 22-31%
Customer preference returns:
- Item didn’t fit: 50%
- Didn’t like the item: 44%
- Buyer’s remorse: 11%
The “bracketing” trend is reshaping returns:
- 51% of Gen Z shoppers intentionally buy multiple sizes/colors to return unwanted items
- 36% of Gen X and 24% of Baby Boomers also engage in this practice
- This behavior treats your store like an at-home fitting room
The rise of bracketing isn’t customer fickleness – it’s a rational response to online shopping uncertainty. Businesses that recognize this can develop solutions like better size guides, AR try-on features, or personalized recommendations.
💼 Connect With $890B Market Opportunity
Scale outbound to ecommerce brands spending heavily on return management and logistics solutions
Paragraph
The Impact of Ecommerce Returns
Returns ripple through every aspect of your business operations, from cash flow to customer relationships.
Financial impacts:
- Direct costs: Processing, shipping, depreciation
- Opportunity costs: Resources tied up in reverse logistics
- Fraud losses: 15.1% of all returns involve some form of fraud
Operational impacts:
- Warehouse efficiency: Return processing disrupts normal workflows
- Customer service load: Return inquiries increase support tickets
- Inventory management: Returned items create forecasting challenges
Customer experience impacts:
- Loyalty effects: Smooth returns build trust; poor experiences destroy it
- Brand reputation: Return policies influence purchase decisions
- Word-of-mouth: Return experiences drive reviews and recommendations
Market differentiation:
- Competitive advantage: Superior return experiences set you apart
- Customer acquisition: Good policies reduce purchase hesitation
- Retention tool: Easy returns encourage repeat purchases
How to Manage Returns
Effective return management starts with prevention but extends through the entire customer journey.
Prevention strategies:
- Enhanced product pages: Multiple high-resolution images, 360° views, detailed descriptions
- Size and fit tools: AI-powered sizing recommendations, virtual try-on features
- User-generated content: Customer photos and reviews provide realistic expectations
- Quality control: Better packaging and fulfillment accuracy reduce retailer-fault returns
Process optimization:
- Self-service portals: Let customers initiate returns without contacting support
- Automated approvals: Speed up the process for qualifying returns
- Smart routing: Direct items to appropriate facilities based on condition
- Real-time tracking: Keep customers informed throughout the process
Technology solutions:
- Return management software: Automates workflows and provides analytics
- Predictive analytics: Identify high-risk orders before they ship
- Integration platforms: Connect returns data with inventory and customer systems
Recovery tactics:
- Exchange incentives: Offer bonuses for exchanges vs. refunds
- Partial refunds: For minor defects that don’t require full returns
- Store credit premiums: Extra value for choosing credit over cash refunds
Best Software for Handling Ecommerce Returns
The right technology can transform returns from a cost center into a competitive advantage.
Top return management platforms:
- Salesso (Best Overall) Leading the pack for businesses serious about turning return insights into growth opportunities. While primarily known for cold email and prospecting, Salesso’s data insights help you identify prospects struggling with return rates and position your solutions effectively.
- Happy Returns (UPS)
- Strengths: Network of physical “Return Bars” for box-free, label-free returns
- Best for: Brands prioritizing customer convenience and sustainability
- Key feature: Consolidation shipping reduces environmental impact
- Loop Returns
- Strengths: Shopify integration, exchange-focused workflows
- Best for: Fashion and lifestyle brands wanting to retain revenue
- Key feature: Branded return portal with customizable policies
- AfterShip Returns Center
- Strengths: Global carrier network, automated workflows
- Best for: International businesses with complex logistics
- Key feature: Real-time tracking across multiple carriers
- Returnly
- Strengths: Instant refunds to encourage repeat purchases
- Best for: High-volume retailers focused on customer loyalty
- Key feature: Advanced fraud detection and risk scoring
Selection criteria:
- Integration capabilities: Works with your existing tech stack
- Automation level: Reduces manual processing work
- Analytics depth: Provides actionable insights on return patterns
- Scalability: Grows with your business volume
- Customer experience: Improves satisfaction throughout the process
🚀 Target Companies With 20-40% Return Rates
Our LinkedIn outbound engine identifies and engages ecommerce brands with urgent return challenges
7-day Free Trial |No Credit Card Needed.
Ecommerce Returns Best Practices
Transform your return process from a necessary evil into a customer retention powerhouse.
Policy design:
- Transparency first: Make policies easy to find and understand
- Competitive benchmarking: Match or exceed industry standards
- Category optimization: Tailor policies to product characteristics
- Seasonal flexibility: Extend windows during peak periods
Process excellence:
- One-click initiation: Minimize friction in starting returns
- Proactive communication: Send updates at every step
- Fast processing: Aim for same-day processing of received items
- Quality assurance: Inspect thoroughly but efficiently
Data utilization:
- Return reason tracking: Identify trends and improvement opportunities
- Customer segmentation: Understand who returns what and why
- Cost analysis: Calculate true return costs by product and category
- Predictive modeling: Flag high-risk orders before they ship
Recovery optimization:
- Exchange first: Design flows that encourage exchanges
- Value-added services: Offer alterations, repairs, or upgrades
- Retention campaigns: Follow up with personalized offers
- Feedback loops: Use return data to improve product development
Team training:
- Empathy focus: Train staff to see returns as service opportunities
- Process knowledge: Ensure consistent, accurate information
- Problem-solving: Empower teams to find creative solutions
- Data awareness: Help staff understand the impact of their decisions
Success metrics:
- Return rate trends: Track by product, category, and season
- Customer satisfaction: Survey return experience quality
- Cost per return: Monitor efficiency improvements
- Retention rates: Measure loyalty impact of return experiences
Ecommerce Returns FAQ
Q: What's considered a "good" return rate for ecommerce?
Q: How can I reduce return rates without hurting sales?
Q: Should I offer free return shipping?
Q: How long should my return window be?
Q: What's the best way to handle return fraud?
Conclusion
Ecommerce returns represent both challenge and opportunity. While the $890 billion in annual returns highlights the scope of the issue, businesses that master return management gain significant competitive advantages.
The data is clear: customers expect seamless return experiences, and 67% won’t shop with you again after a poor return experience. But those who invest in prevention strategies, optimize their processes, and leverage the right technology can reduce costs while improving customer satisfaction.
Remember, every return is valuable data about your customers and products. Use these insights to refine your offerings, improve your marketing, and build a more profitable business.
Success in ecommerce isn’t about eliminating returns entirely – it’s about managing them so effectively that they become a competitive advantage.
Ready to transform your return challenges into growth opportunities? Start by understanding your data, implementing the right processes, and choosing technology that scales with your business.
Target Ecommerce Brands With Return Challenges
Reach decision-makers struggling with high return rates using our LinkedIn outbound engine
Segmentation That Actually Converts
LinkedIn outbound targets precise demographics with strategic campaign design and scaling methods